Toolbox
Toolbox is a multifunctional window. It shows the results of various actions performed in MetaEditor: compilation, search, profiling and debugging. Besides, it provides access to the extensive library of source codes and articles about MQL4/MQL5 programming.
The Journal tab informs of actions performed in MetaEditor, for example, the ones performed during MQL5 Storage operation.
You can show or hide this window using the ![]() Toolbox command of the View window or in the Standard toolbar to show/hide the window.
Toolbox command of the View window or in the Standard toolbar to show/hide the window.
Errors #
The tab displays the program compilation logs: data on applied files, errors and warnings.

The log contains the following data:
- Description – event description. Icons show a type of an event:
 – error,
  – warning,
  – information message.
 - File – name of a processed file. When hovering a mouse cursor, a tooltip indicating the full file path appears.
- Line – number of a line containing an error or a warning.
- Column – number of a column containing an error or a warning.
Double-click an error message, to open an appropriate file. The cursor is immediately set to the error location. A similar action is performed using the ![]() Go to Line command in the context menu.
Go to Line command in the context menu.
Search #
Results of the search in files and MQL5.community are displayed in this tab.
MetaEditor features the smart and high-performance search throughout MQL5.community – community of traders and MQL4/MQL5 developers. The site contains all kinds of useful information: documentation, forum, blogs of traders and analysts, articles related to programming and platform use. The community provides access to the huge source code database and the application store for the platform.
In addition to MQL5.community, the search includes other popular platforms, such as GitHub, MSDN and Stack Overflow.
The search is performed using the toolbar and the Online Search command in the Help menu. Search results are conveniently displayed by categories:

To have the most recent publications displayed at the top of the list, enable the "Sort by date" option to the right of the categories.
Search in files is performed using the toolbar and "Find..." command in the Search menu. Results are displayed in the following form:
- File – name of a file where a search query line is found with a full file path.
- Line – number of a file line where a necessary phrase is found.
- Text – found text. The entire structure where the phrase has been found is displayed here.

To go to the found text, double-click the file name. A similar action is performed using the ![]() Go to Line command in the context menu.
Go to Line command in the context menu.
Profiler #
This tab displays results of profiling a program's source code. Profiling allows you to optimize a source code by detecting the slowest fragments in it.
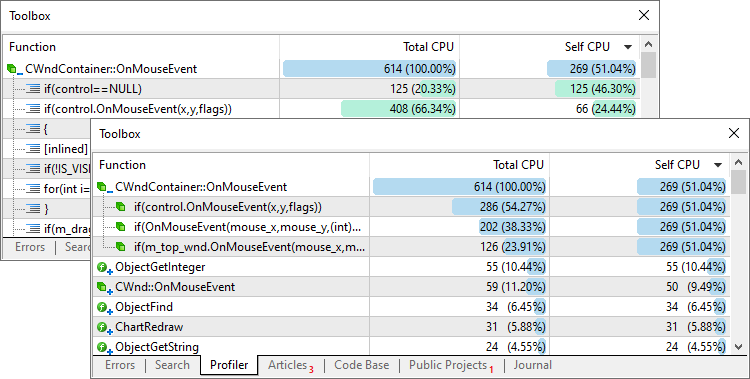
Function name
Number of a line the function description starts from
Number of function calls performed during profiling
Time spent on the function execution: in milliseconds and as a percentage of a total time spent for executing all functions
Graphical representation of a time spent for the function execution
Context menu:
- Open – move to a line or a function in a source code file. The same can be done by double-clicking or pressing Enter.
- Expand All – expand all collapsed functions.
- Collapse All – collapse all expanded functions.
- Functions by Lines – switch to viewing profiling results by lines.
- Functions by Calls – switch to viewing profiling results by calls.
- Export – export profiling results in Open XML (MS Office Excel), HTML (Internet Explorer) or CSV (Text file).
- Auto Arrange – enable/disable automatic sizing of fields. The same action can be done by pressing A.
- Grid – show/hide grid to separate fields. The same action can be done by pressing G.
Find detailed instructions on profiling in a separate section.
Debug #
The Debug tab is displayed only when the process is launched. The window is divided into two parts. The left one displays the call stack, while the right one – values of observed expressions:

Call stack
The following data on the call stack is shown:
- File – name and path of a file the function is called from.
- Function – name of a function, within which the current program execution step is conducted.
- Line – number of a line the program execution is stopped at.
If not a single breakpoint is enabled and no step-by-step debugging commands are executed, the left part remains empty. The context menu allows you to show and hide the grid separating fields and set auto sizing of columns.
Observing expressions
The right part of the Debug window is intended for observing expression values during debugging:
- Expression – tracked expression name.
- Value – tracked expression value.
- Type – expression type.
If the expression value is not defined or not calculated at the moment, the appropriate field displays "Unknown identifier". The icons for these expressions look like this: |
To add an expression to the observation, select it in the source code of the program and click ![]() Add Watch in the context menu. Also, the observed expression can be added through the context menu of the tab: click
Add Watch in the context menu. Also, the observed expression can be added through the context menu of the tab: click ![]() Add and specify the expression name.
Add and specify the expression name.
Articles #
The tab provides access to an extensive library of articles on MQL4/MQL5 programming published on MQL5.community website. Articles are an excellent guide for creating applications, since they cover a lot of practical tasks involving algorithmic trading. New articles are published every week.

All articles are conveniently divided into categories by subjects, for example, trading, indicators, Expert Advisors, strategy tester, etc. You can sort out articles by categories via the context menu. To view an article, double-click its name or click ![]() View in the context menu. The article will be opened in a separate browser window.
View in the context menu. The article will be opened in a separate browser window.
Before reading the article, you can view its brief description. To do this, hover the cursor over its name.
Code Base #
The tab provides access to the library of MQL4/MQL5 source codes. The Code Base contains thousands of trading robots, indicators and scripts. Studying a source code of ready-made programs helps to better understand the principles of programming. They can also be used as a basis for your own development.

Name, short description, rating (defined by MQL5.community users) and publication date are displayed for each program. To view detailed information about the program on the website, double-click on it. To download the program, click ![]() Download in the context menu.
Download in the context menu.
|
All programs are divided into several categories marked with the corresponding icons:
 – Expert Advisors
 – indicators
 – scripts
 – libraries
Use the context menu to sort out programs by categories.
Public projects #
Each shared project in MQL5 Storage has publicity settings: the project can be private or open to other users. All projects you can join are displayed in the separate Public Projects tab:

Title, description, author name, number of changes (commits) and creation date are displayed for each project.
To participate in the project, click ![]() Join. After that, the project will appear in the Shared Projects section. Then click
Join. After that, the project will appear in the Shared Projects section. Then click ![]() Update from Storage in the context menu of the project in order to download it to your computer. Details on public projects are described in the separate section.
Update from Storage in the context menu of the project in order to download it to your computer. Details on public projects are described in the separate section.
Log #
The journal tab informs you of actions performed in MetaEditor, for example, the ones performed in MQL5 Storage, as well as notifications on the availability of the new MQL4/MQL5 language or MetaEditor Reference, etc.

The journal displays the following information:
- Time – event date and time.
- Source – event type: Storage (MQL5 Storage), help (reference guide), etc.
- Message – event description.
All events are divided into three types marked by an appropriate icon:
 – information message
 – warning
 – error message
To go to the MetaEditor journal file (metaeditor.log), click ![]() Open in the context menu. When running this command, the current journal entries are saved in a file. The journal file is saved in the /Logs directory of the trading platform.
Open in the context menu. When running this command, the current journal entries are saved in a file. The journal file is saved in the /Logs directory of the trading platform.