Code debugging
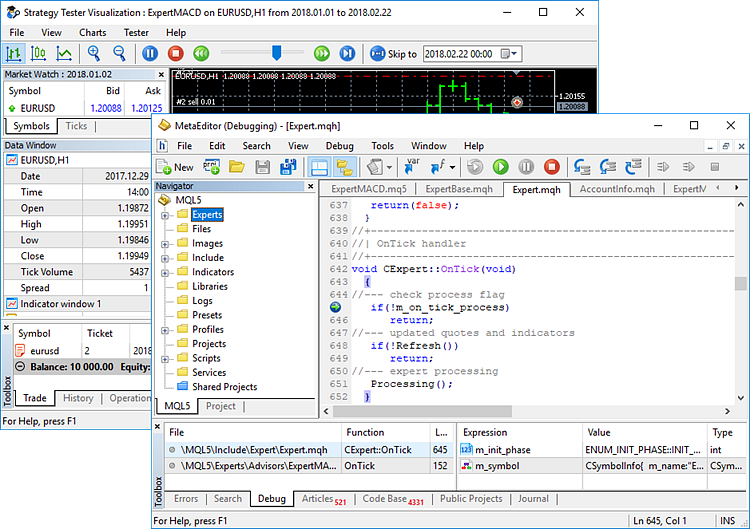
MetaEditor has a built-in debugger allowing you to check a program execution step by step (by individual functions). Place breakpoints in the code. These are the places where the program execution should be paused. Then launch the program on a regular chart or the strategy tester. As soon as the program reaches a breakpoint, it is paused. This allows you to see the values of calculated variables and then continue program execution step by step checking the execution algorithm.
- Presetting
- Breakpoints
- Launching debugging
- Observed expressions
- Viewing a call stack
- Step-by-step debugging
- Pausing, resuming and ending debugging
- Debugging on history
Presetting #
Before debugging, set its general parameters in MetaEditor settings. You can specify a symbol and a period of chart, on which the debugging of applications is to occur. Such a chart is temporarily created every time you start debugging and removed immediately after its completion.
debug.tpl template located in the /profiles/templates folder of the trading platform is applied to a debugging chart. |
Breakpoints #
A breakpoint is a command triggered when a program execution reaches a specified string. The command stops the execution at that string. Breakpoints allow examining a program behavior in a specified code area: view the variable values and the stack of functions. In the future, the debugging process can be resumed or terminated.
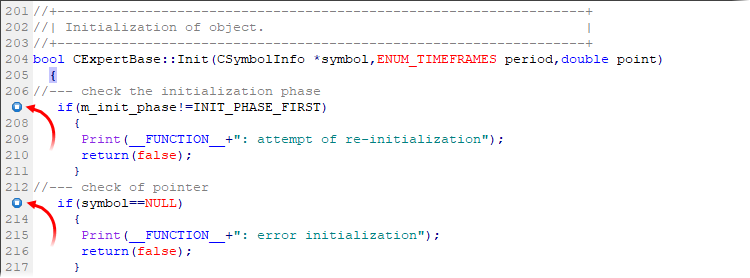
Before launching a debugging, set at least one breakpoint in the program code. To do this, double-click on the gray field to the left of the code line. You can also place a cursor on the line and click ![]() Toggle Breakpoint in the Debug menu or F9. Breakpoints are disabled the same way.
Toggle Breakpoint in the Debug menu or F9. Breakpoints are disabled the same way.
If you need to jump to the point, at which program execution stopped, double click on the function in the call stack viewing window. Also, using the window context menu, you can open the list of all breakpoints in the currently debugged program:
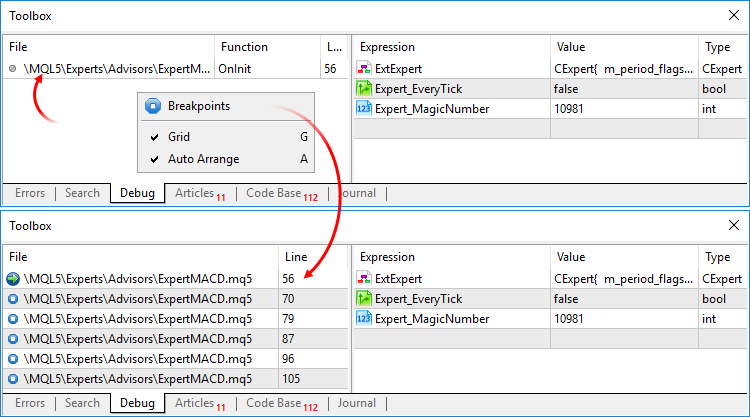
You can jump to any breakpoint by double-clicking on it.
Launching debugging #
To run debugging, open the main program file or a project. Debugging can be performed in two modes:
- On real data. Debugging is launched by the
 Start on Real Data command in the Debug menu or F5. In this mode, the debugged program runs on a special chart in the trading platform. Debugging is performed in real conditions using price data arriving from the server.
 - On history. Debugging is launched by the
 Start on History Data command in the Debug menu or Ctrl+F5. A program in this mode is launched in the Strategy Tester. Use it to test program performance in any desired history interval, without waiting for specific market conditions. The non-visual testing mode is used by default to avoid extra resource usage while rendering graphic elements. The visual mode can be enabled in MetaEditor settings.
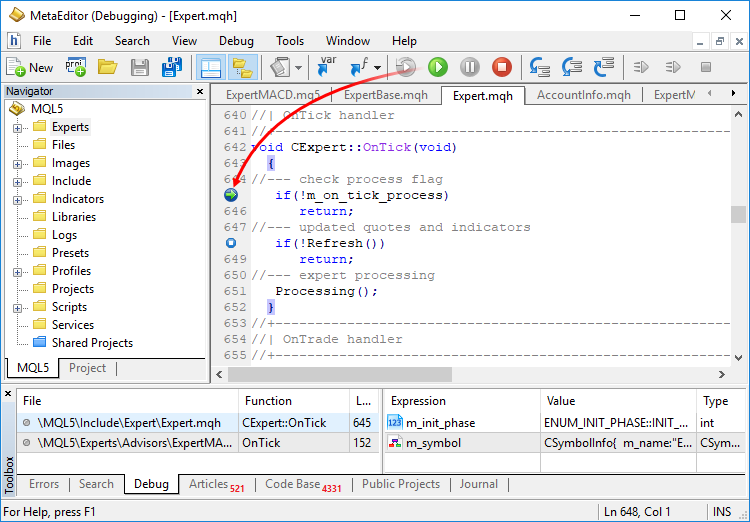
As soon as the program execution in debugging mode reaches a breakpoint, it is paused. The line the execution is paused on is marked with the ![]() icon. The Debug tab also appears in the Toolbox window. Its left part displays the function call stack.
icon. The Debug tab also appears in the Toolbox window. Its left part displays the function call stack.
Observed expressions #
During debugging, the values of various expressions (variables) can be tracked on the current program execution step. The right part of the Debug tab of the Toolbox window displays the appropriate results. To track expression values, add it to the observed ones:
- During the debugging, place the cursor on an expression in the source code and click
 Add Watch in the context menu.
 - Click
 Add in the context menu of the right part of the Debug tab. Enter the expression name in the newly appeared line.
 - To change the name of the tracked expression, double-click on it.
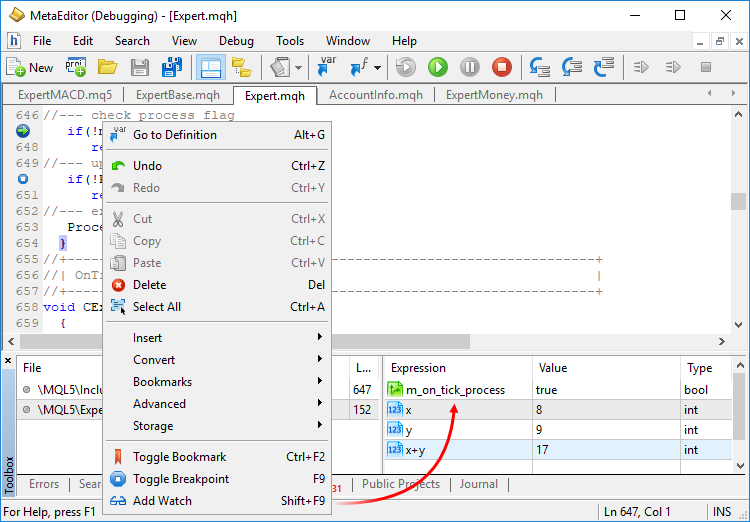
You can also enable automatic display of local variables in the debugger watchlist. The display can be enabled by the "Local" command of the context menu. As the debugger operation proceeds through the code, variables from the current scope are automatically displayed in the list.
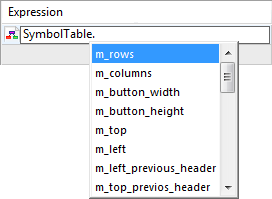
In the expression observation window, you can perform simple mathematical calculations (addition, subtraction, multiplication and division), as well as view values at specific array points, for example, by specifying A[3][4] entry, where A is an array name, while 3 and 4 are positions in its dimensions. When adding objects to observed expressions, we can view the list of their members by specifying a full stop in the end or clicking Ctrl+Space:
To view the contents of an array or object, double-click on it in the observation window.
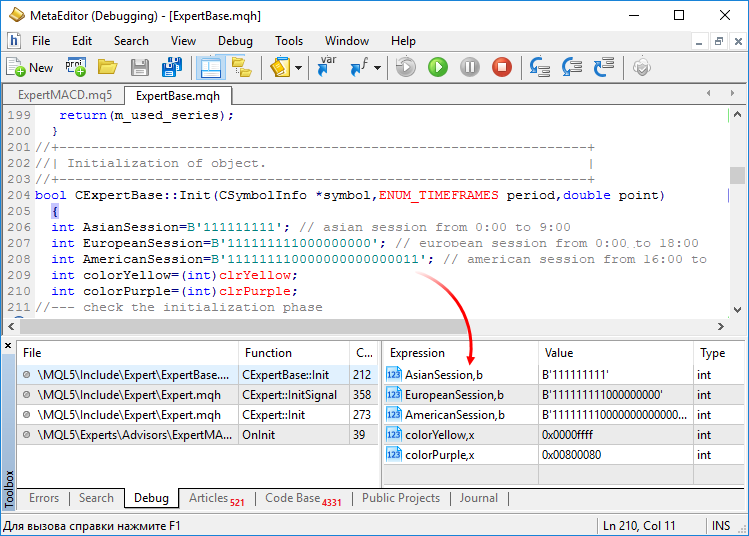
By default, integers are displayed in the observation window in decimal form. To display the value in binary or hexadecimal form, specify the comma-separated b or x modifier accordingly in the Expression field.
Viewing a call stack #
Data for returning control from sub-programs (nested functions) to the program (main event handler OnInit, OnTick, etc.) is specified in the call stack. The stack allows you to track the entire sequence of an event occurrence in the trading platform up to calling a specific function.
The following data is displayed for each function:
- File name the function is called from.
- Function name.
- Line number in the file where the function is called.
Debug menu or Standard toolbar commands are used for step-by-step debugging with the ability to view the call stack:
 Step Into – move one step of program execution accessing the called functions. The same action is performed by pressing F11.
 Step Over – move one step of program execution without accessing the called functions. The same action is performed by pressing F10.
 Step Out – execute a single step of a program one level higher. The same action is performed by pressing Shift+F11.
The step-by-step debugging commands can be used only after the program is paused in debug mode:
- After a breakpoint is triggered.
- After a program is paused manually by
 Pause command in the Debug menu or pressing Break.
Events continue occurring in the trading platform even if the program is at a breakpoint. All occurred events are placed in a queue and their processing using an expert is continued after the current event handler exits the code. |
Pausing, resuming and ending debugging #
Program is stopped automatically during debugging as soon as the execution reaches a string with a breakpoint installed. Debugging can also be managed manually:
- Pausing execution
Program execution during debugging can be paused manually by using Pause command in the Debug menu or pressing Break. After pausing, you can apply step-by-step debugging commands.
 - Resuming execution
To resume the program execution after a pause, click Resume in the Debug menu or press F5.
 - Completing debugging
To stop debugging, click Stop in the Debug menu or press Shift+F5. The program is removed from a special chart, on which it was launched for debugging, while the chart itself is closed.
|
Debugging on history #
Apart from real-time price data, debugging of trading robots and technical indicators can be performed on history as well. Any program can be tested on required history data without waiting for certain trading events in real time.
Debugging on history data runs in the visual testing mode in the Strategy Tester. An application is executed on a chart based on an emulated sequence of ticks in the tester or accumulated history ticks (received from a broker).
To start debugging on history, set testing parameters in MetaEditor settings.
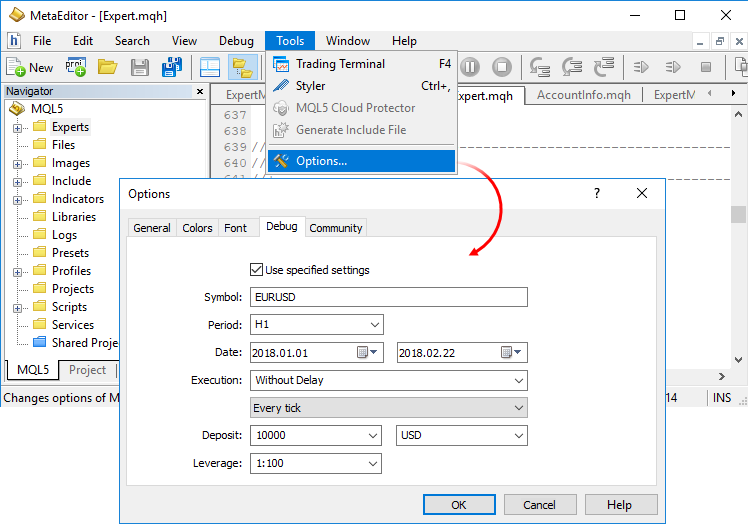
Set the breakpoints in the code, and then start the debugging using historical prices.
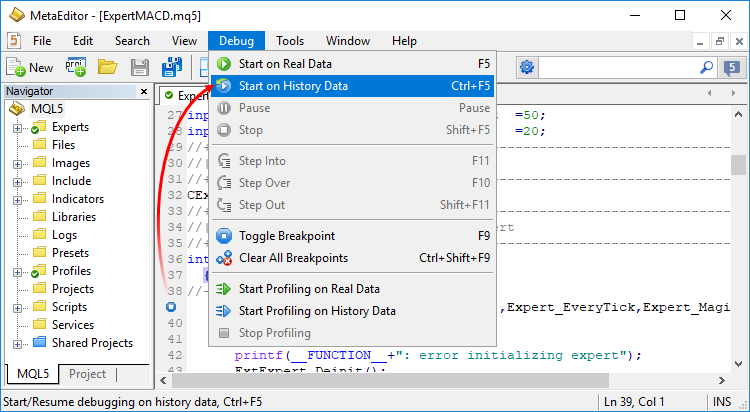
This will initiate visual testing and the debugging process.
