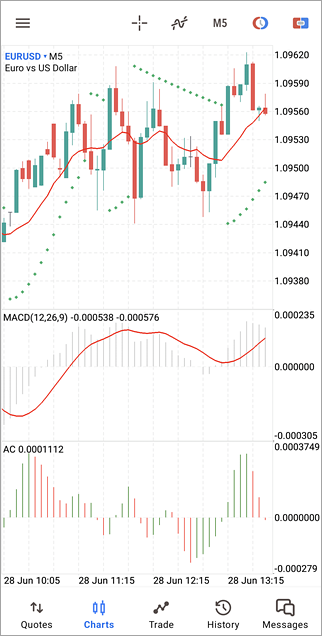
Indicators for Technical AnalysisA technical indicator is a mathematical transformation of a security price and/or volumes aimed at forecasting future price changes. Decisions about how and when to open or close positions can be made on the basis of signals produced by technical indicators. Indicators can be divided into two groups based on their functional properties: trend indicators and oscillators. Trend indicators help to assess the price direction and detect the reversal moments synchronously or with a delay. Oscillators help to find reversal points in advance or synchronously. MetaTrader 5 for Android provides 30 indicators. They are divided into the following groups: A technical indicator can be drawn in a separate indicator window with its own vertical scale (for example, MACD) or applied directly to a price chart (like Moving Average). Each indicator has a specific set of parameters. |
|
|
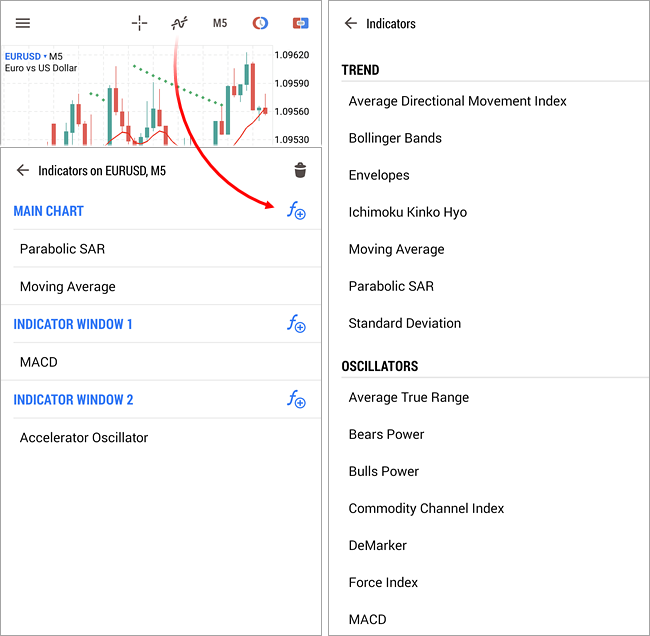
Adding Indicators #Tap Otherwise, the list of chart windows will open. Tap If the selected indicator should be plotted in a separate window (such as, for example, MACD), the window will be created automatically. Once an additional window is created, you can add indicators to this window.
|
||
|
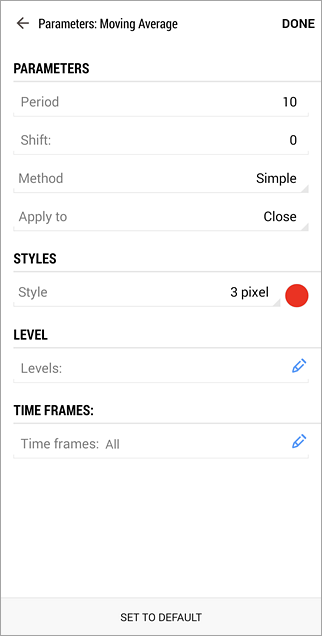
Indicator Settings #Each indicator has a specific set of parameters. Parameters are set when an indicator is attached to the chart. One of the common parameters is "Apply to". Indicators can be plotted based on price data and derivatives thereof (Median Price, Typical Price, Weighted Close), as well as on the basis of other indicators. For example, a Moving Average can be constructed based on MACD values. To do this, first plot the MACD indicator, and then in its window add MA, selecting in the "Apply to" field of its settings the "Previous indicator's data" option. If you select "First indicator's data", MA will be constructed on the basis of the very first indicator, which is not necessarily the MACD. Nine variants of indicator construction are available:
|
|
In addition to this parameter, you can set the Period, Method, Shift and many other parameters of indicators. |
||
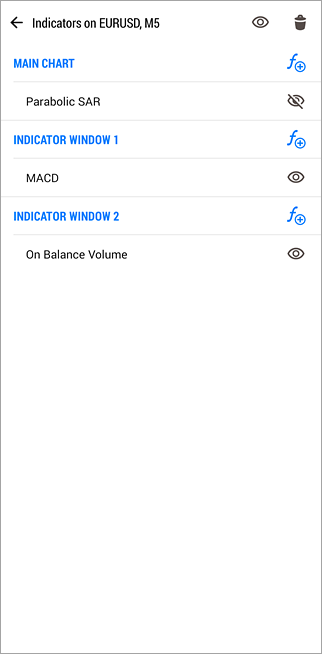
Removing Indicators #To delete indicators, tap Modifying IndicatorsTo open the settings of a previously launched indicator, tap |
|
|
|
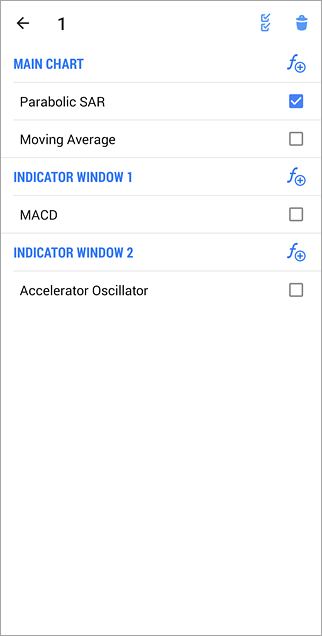
Hiding Indicators #To quickly view a "clean" chart without deleting the previously added indicators, tap Also, in indicator settings, you can additionally specify the timeframes on which the indicators will be displayed. |
|
