9 July 2018
Create any indices to solve your tasks
We have added calculation for the price history of synthetic symbols for the entire available data depth
We have added calculation for the price history of synthetic symbols for the entire available data depth. Previously, the history was only calculated for the last two months. A deeper history could be created only upon an explicit request (when scrolling the chart to the left or calling Copy functions).

How it works
Each symbol used in the formula can have a price history of different depth. Therefore, the calculation is performed for the shortest available period. For example, the formula uses three financial instruments:
- EURUSD with the history down to January 1, 2009
- USDJPY with the history down to June 1, 2012
- EURJPY with the history down to June 1, 2014
In this case, the history of the synthetic symbol will be calculated for a period from June 1, 2014 to the present. 100 minutes will be additionally discarded from this date, to ensure calculation integrity. If any minute bar is not available in history, a previous minute bar is used in the calculation.

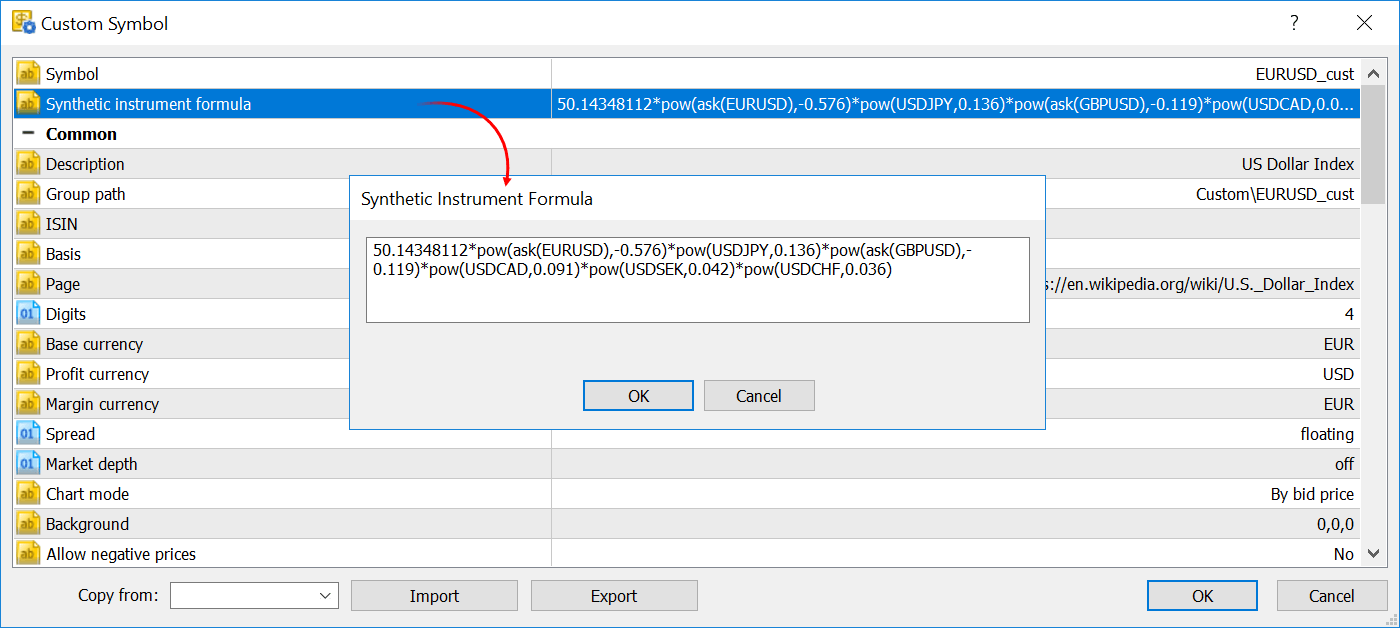
The U.S. Dollar Index equation is used in the example above:
USDX = 50.14348112*pow(ask(EURUSD),-0.576)*pow(USDJPY,0.136)*pow(ask(GBPUSD),-0.119)*pow(USDCAD,0.091)*pow(USDSEK,0.042)*pow(USDCHF,0.036)
If the history is deep, the calculation can take quite a long time. The history for the last two months is calculated first, in order to view the chart immediately. An earlier history is generated afterwards.
See the full list of changes implemented in MetaTrader 5 build 1880 for more information on the new version of the trading platform.
Download the updated MetaTrader 5 and try its new synthetic symbols features!
- MetaTrader 5 build 1880: calculation of the complete history of synthetic symbols
- MetaTrader 5 build 1870: adding symbols to Market Watch by ISIN
- Brokeree Solutions releases PAMM for MetaTrader 5
- Major update of MetaTrader 5 for brokers: App Store and back office functionality
- Five important MetaTrader 5 build 1860 features for algorithmic traders