1 March 2023
Find out if your customers are happy
Building long-lasting relationships with customers is key to your business success. A long-term, repeat customer should be cherished as one of the best assets of your company. One of the essential business objectives is to build a loyal client base on which the company can rely even in difficult times
Building long-lasting relationships with customers is key to your business success. A long-term, repeat customer should be cherished as one of the best assets of your company. One of the essential business objectives is to build a loyal client base on which the company can rely even in difficult times. Therefore, it is strategically important to track customer behavior in an effort to gauge their satisfaction.
Perhaps the most challenging part of this task is accessing reliable data. How can you measure the satisfaction level? Should you conduct polls or ask for feedback? A more reliable option is available in web analytics: the Retention metric is one of the fundamental tools which is capable of measuring customer satisfaction and business success as a whole.
The Retention report in Finteza Analytics assists in analyzing and improving relationships with your customers. It demonstrates the efficiency of your client retention efforts. The report shows how often a certain group of users repeat certain actions in a site or in an application. In brief, the report answers the following questions: How many customers return after the first visit and how often they return. Utilize this information to improve the efficiency of customer operations, to objectively evaluate marketing results and, ultimately, to build long-lasting relationships with your clients.
How the report works
First, you should define some event according to which a category of users will be formed. It is called a Start Event. For example, you may be interested in users who visited your site on a certain day (when you ran a promotion), came from a certain resource (from a partner site) or executed a certain action (registered or visited the landing page). By using fine settings, you can further break down the audience into more specific groups. The Start Event condition can be set, for example, to an Android user from France who has purchased something via the English site version on Christmas and who has used the accessible site version.
Then select an event to follow — the Tracked Event. You can apply refining conditions and further narrow down the analyzed audience in order to study all online events in detail.
Let us consider a simple example. Suppose you have a food delivery service. On January 1, you ran a promotion in your website, offering a 50% discount on all orders. Now you want to find out if the promotion participants have become your repeat customers or if they were attracted once by low prices.
How it looks like in Finteza:

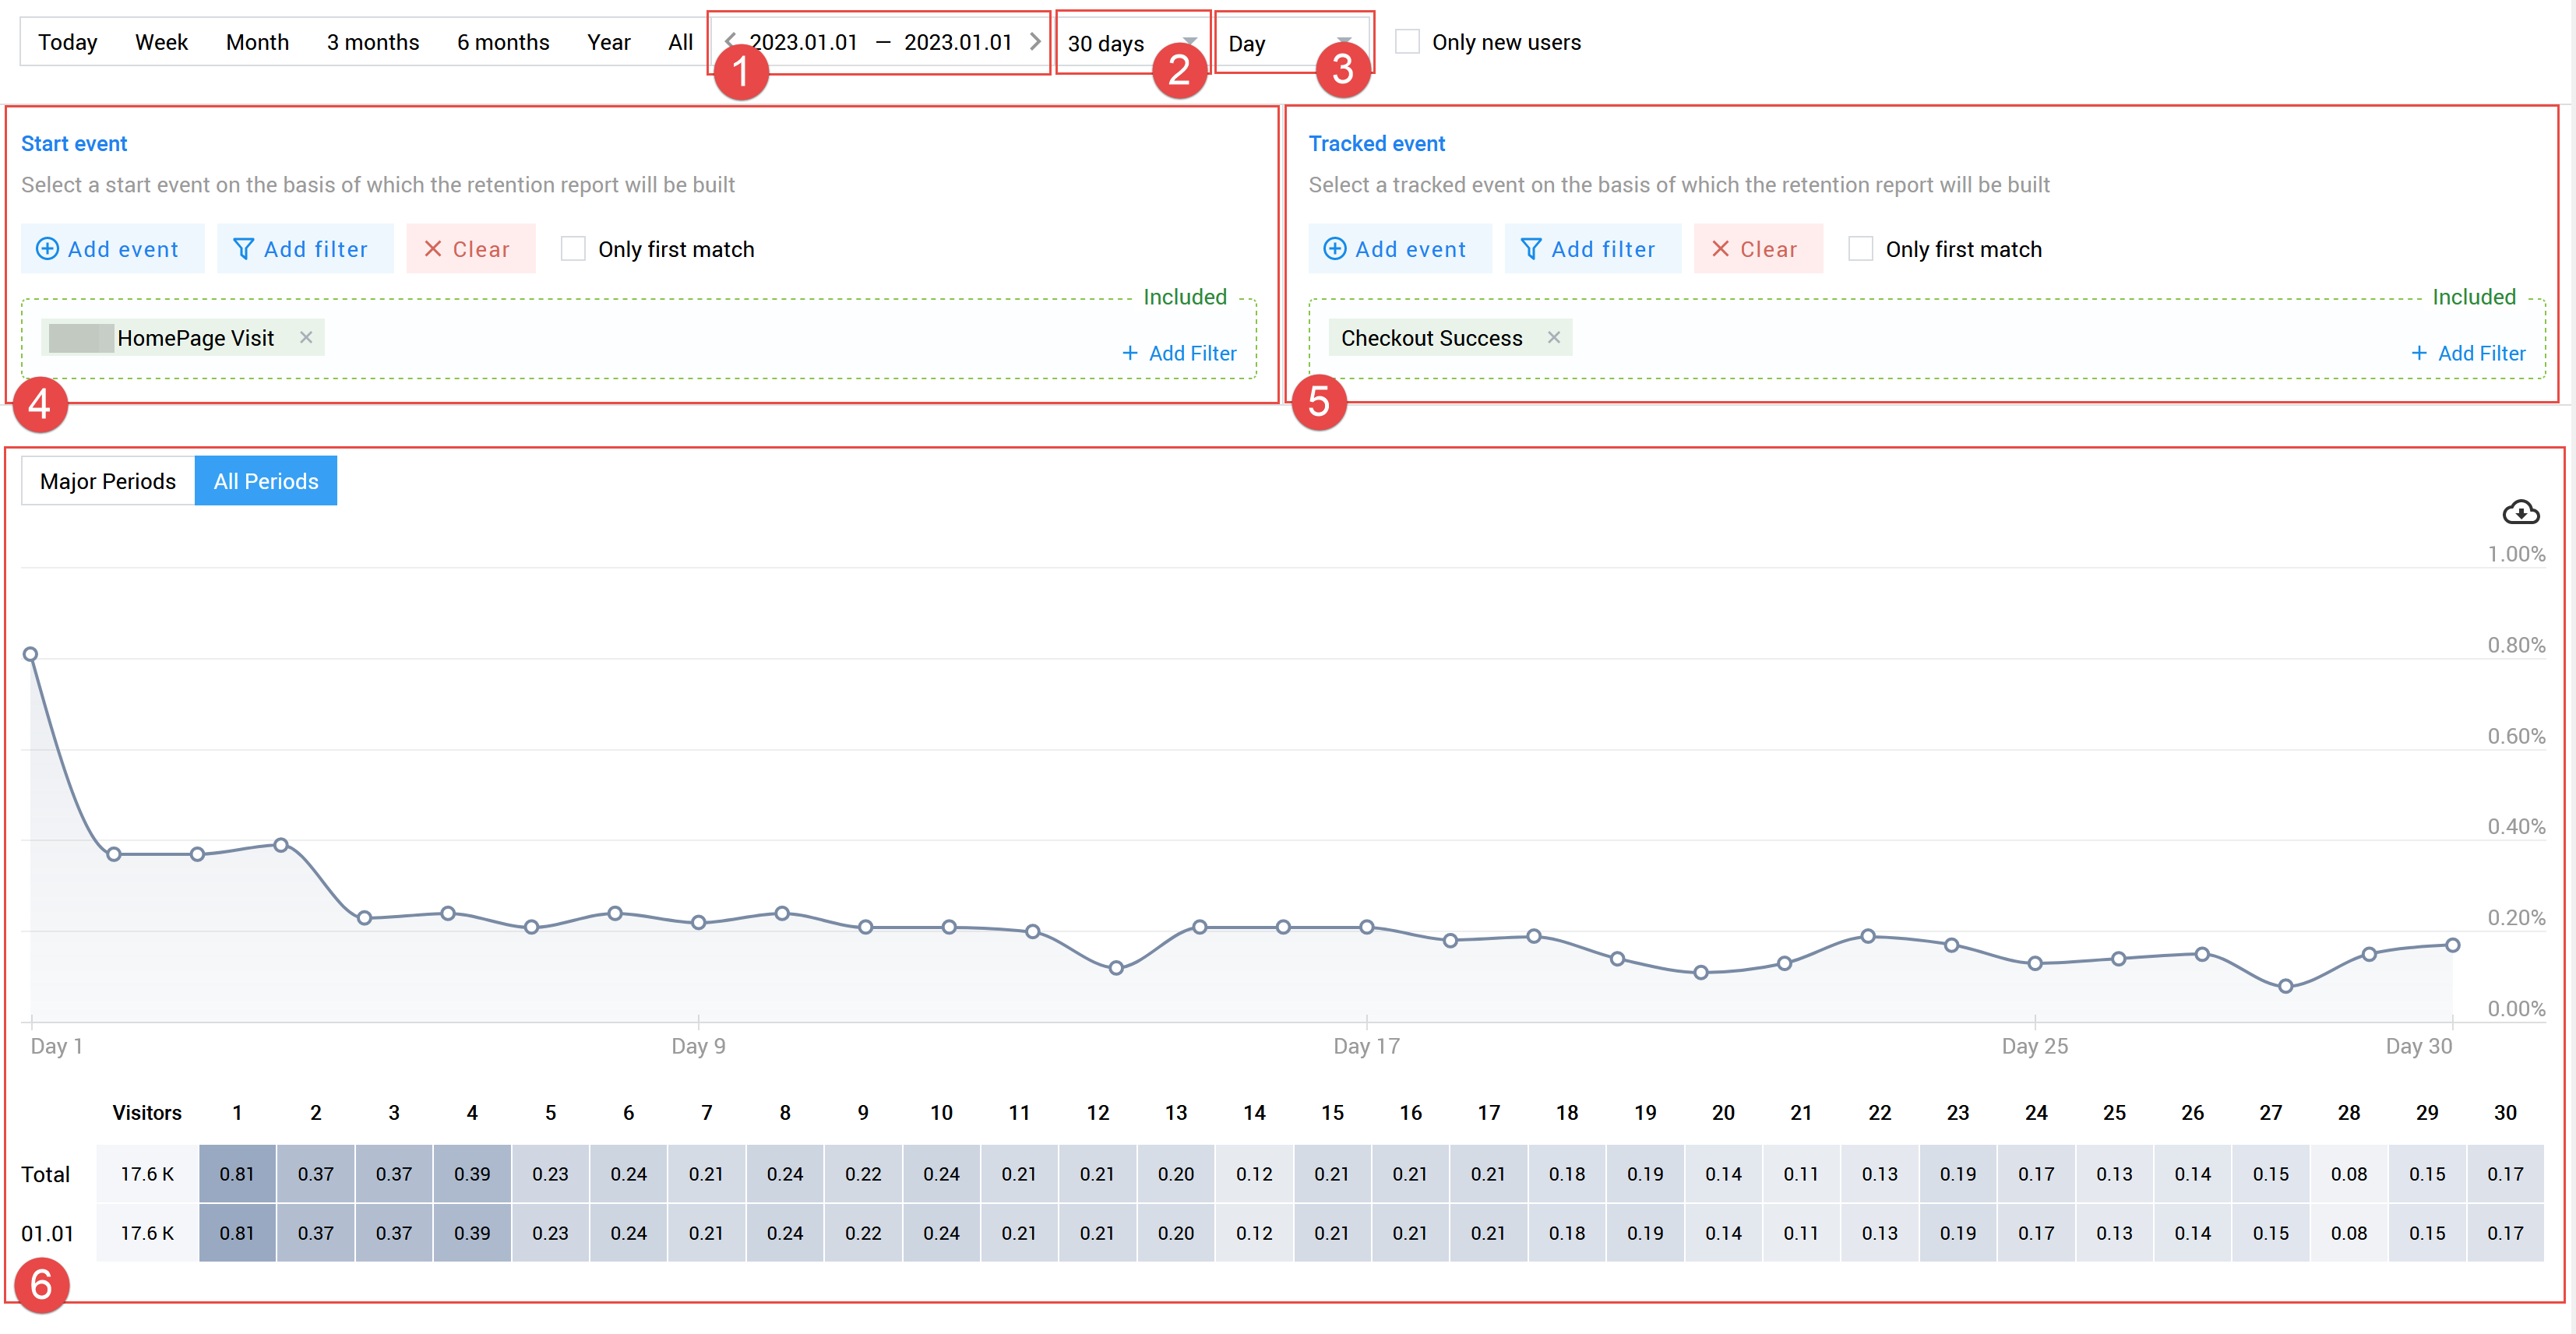
- The Start Event period is January 1, 2023.
- The Tracked Event period is 30 days.
- For report details, we use a breakdown by days.
- The Start Event condition includes home page visits.
- The Tracked Event condition is Checkout Success.
- The results are displayed as a graph and as a table.
Most of the users who visited the site on January 1 (there were 17,600 users) purchased something only during the first four days, while most of the purchases were completed on the promotion day. Most likely, such activity was associated with the New Year holidays rather than the promotion. On the fifth day, the purchase level falls and stays at around 0.2%. Unfortunately, the promotion did not generate the desired result in the long run. Next time, instead of offering discounts, select another audience engagement method to grow a database of returning and loyal customers.
The Retention report solves many important tasks and is useful for almost all members of your team:
- Marketers can evaluate the prospects of their projects and promotions — whether they are worth supporting or whether it is more reasonable to abandon.
- UX designers can see how changes in the site work — how audience behavior has changed after they redesigned the interface or functionality.
- Sales teams can calculate the cost of increasing the customer base — predict audience growth and set it against the associated costs.
- CEO can use the report to define Product Market Fit, which is one of the key indicators of product success and viability.
Conducting customer Retention analysis is crucial for any business survival and growth. This tool will show you how satisfied customers are with your services and how you can improve your business processes to attract and retain more loyal customers.
- 3 types of algorithmic traders who need a VPS
- Meros Equity Global Management launches a new asset class for brokers – pre-IPO and IPO investments available on MetaTrader 5
- How Finteza can make your website more attractive to customers
- MetaQuotes has released a messaging app with financial news and analytical tips for traders
- Automations: your assistant for the most burdensome tasks