5 September 2013
Trading Signals Statistics Expanded on MQL5.com Website
We have implemented a number of changes to Signals statistics to simplify evaluation of results
We have implemented a number of changes to Signals statistics to simplify evaluation of results. Now, you can quickly assess the trading activity of a selected signal, as the informative value of the charts has been considerably improved.
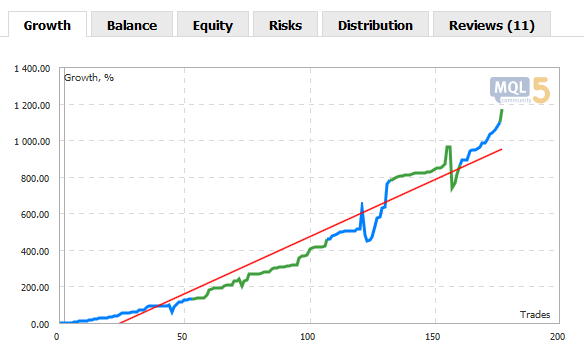
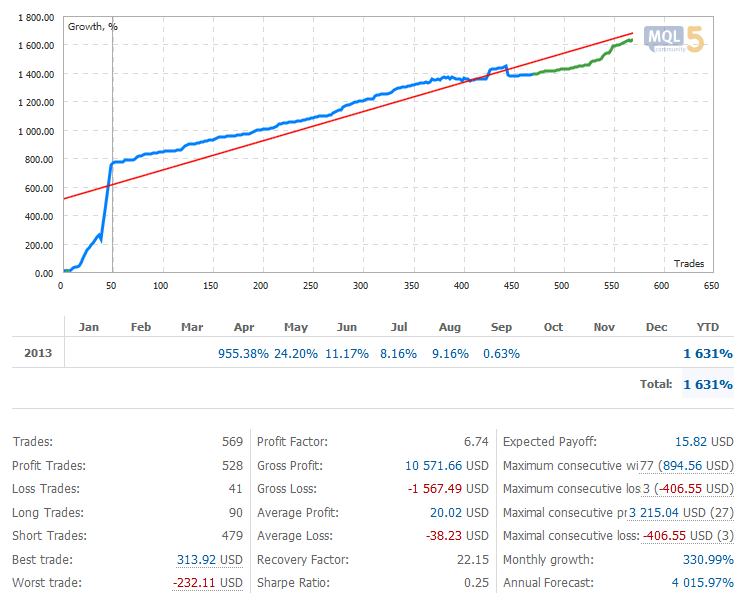
First, Growth and Balance charts now feature the vertical line dividing them in two parts - the time intervals before and after connecting the signal to the monitoring. Thus, it is possible to trace the point, at which the signal has been connected to the monitoring, and examine the differences in trading activity between these time intervals.
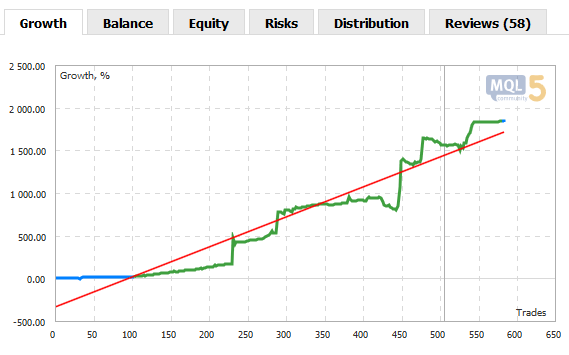
Second, blue and green parts of Growth and Balance charts are now interchanging at each non-trading operation (depositing or withdrawing the funds from the account). The more such interchanges you can see, the more non-trading operations have been detected on the account. View the signal's history to determine the type of each non-trading operation (depositing or withdrawal).
Third, Risks tab has been implemented. It consists of MFE (Maximum Favorable Excursion - maximum profit that could have been fixed before closing the trade) and MAE (Maximum Adverse Excursion - maximum loss detected during the trade) distribution dot diagrams. Each deal has its own potential profit (MFE) and potential loss (MAE) values displayed on the appropriate diagrams. Besides, these diagrams also display best and worst trades, maximum consecutive wins and losses, as well as maximal consecutive profit and loss.
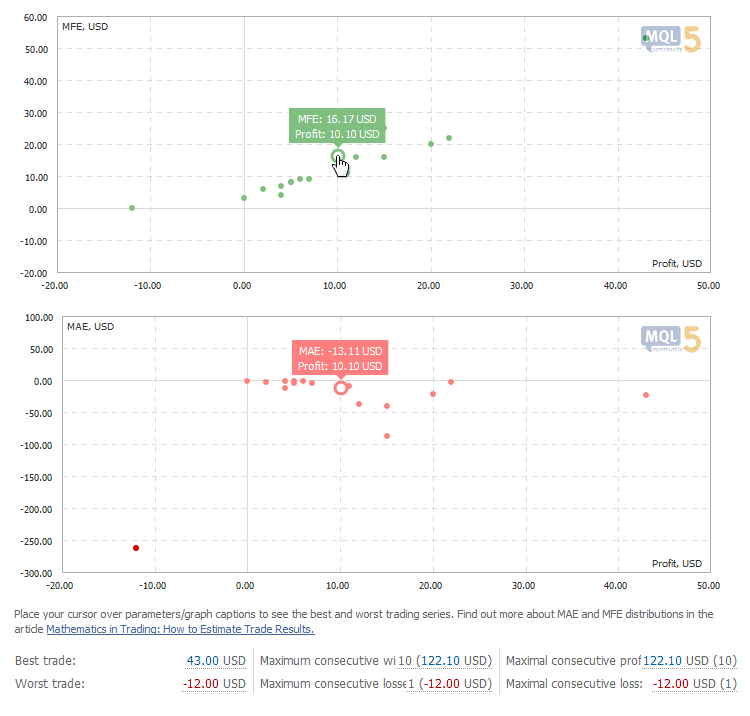
Fourth, best and worst trading series can now also be seen on Growth and Balance charts. Just hover your mouse cursor over the necessary parameters in the table below.
With the extended statistics, traders can quickly see the results of signal's trading activity and assess their risks. This can be useful both for potential Subscribers and those who want to enable private monitoring of their accounts. Open the description of any signal on the website and try the extended statistics right now!
Earlier publications:
- Eight Languages for MQL5 Reference: Now Available in Portuguese
- MQL5.community: Private Monitoring Included in Trading Signals
- MetaTrader 5 Gateways & Connectivity
- MetaTrader 5 Trading Platform Integrated with FastMatch Liquidity Provider
- MetaTrader 5 Trading Platform Certified by Australian Securities Exchange (ASX)