- Accumulation/Distribution
- Money Flow Index
- On Balance Volume
- Volumes
- Market Profile
Market Profile
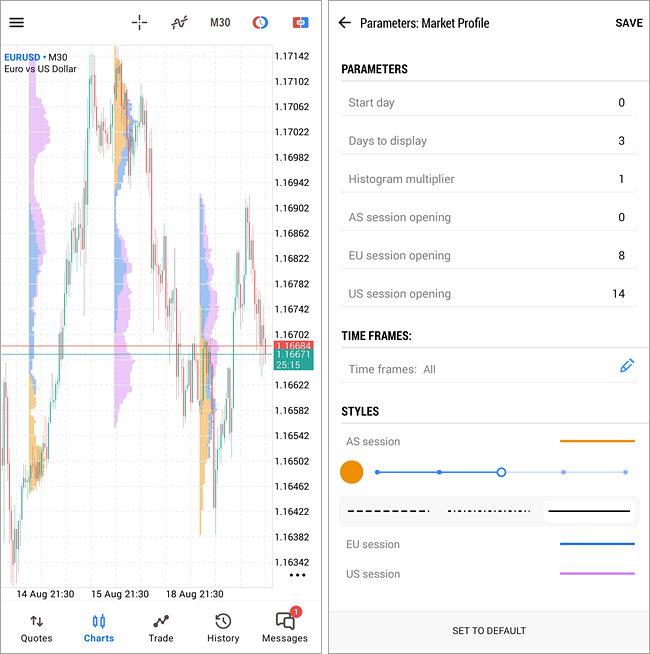
The Market Profile indicator constructs vertical volume profiles by trading sessions (Asia, Europe, America), visualizing areas where the price spent the most time. It analyzes intraday bars and divides them into three time periods corresponding to the different market sessions. The indicator calculates the time spent at each price level during these sessions and visually represents it as rectangles on the chart.
Key features of the indicator:
- The trading day is divided into three sessions: Asian, European, and American.
- Colored zones on the chart indicate the amount of time spent at each price level within each session.
- Each price level is colored according to the session and the duration the price remained there. Levels where the price stayed longer are considered significant, as they reflect areas of active trading.
- The indicator does not calculate the POC (Point of Control) directly, but you can visually identify levels with the longest colored zones. These are control points, indicating key supply and demand levels.
- Areas with higher volume concentration, known as Value Areas, where the price spent more time, can be considered levels to which the price may return.
Thus, the Market Profile indicator helps identify the price levels where the main activity occurred during the day and highlights support and resistance levels for each trading session.

Parameters
The Market Profile indicator includes the following parameters:
- Start day – the day from which the calculation begins. 0 = current day, 1 = previous day, etc.
- Days to display – the number of days displayed, including the start day.
- Histogram multiplier – a multiplier for the histogram bar length.
- AS/EU/US session opening – opening hours for the Asian, European, and American sessions.
You can also specify the timeframes on which the indicator will be displayed and the line style for each session.
For more details, see the article: "Market Profile indicator" |