17 December 2018
Finteza now provides traffic quality details
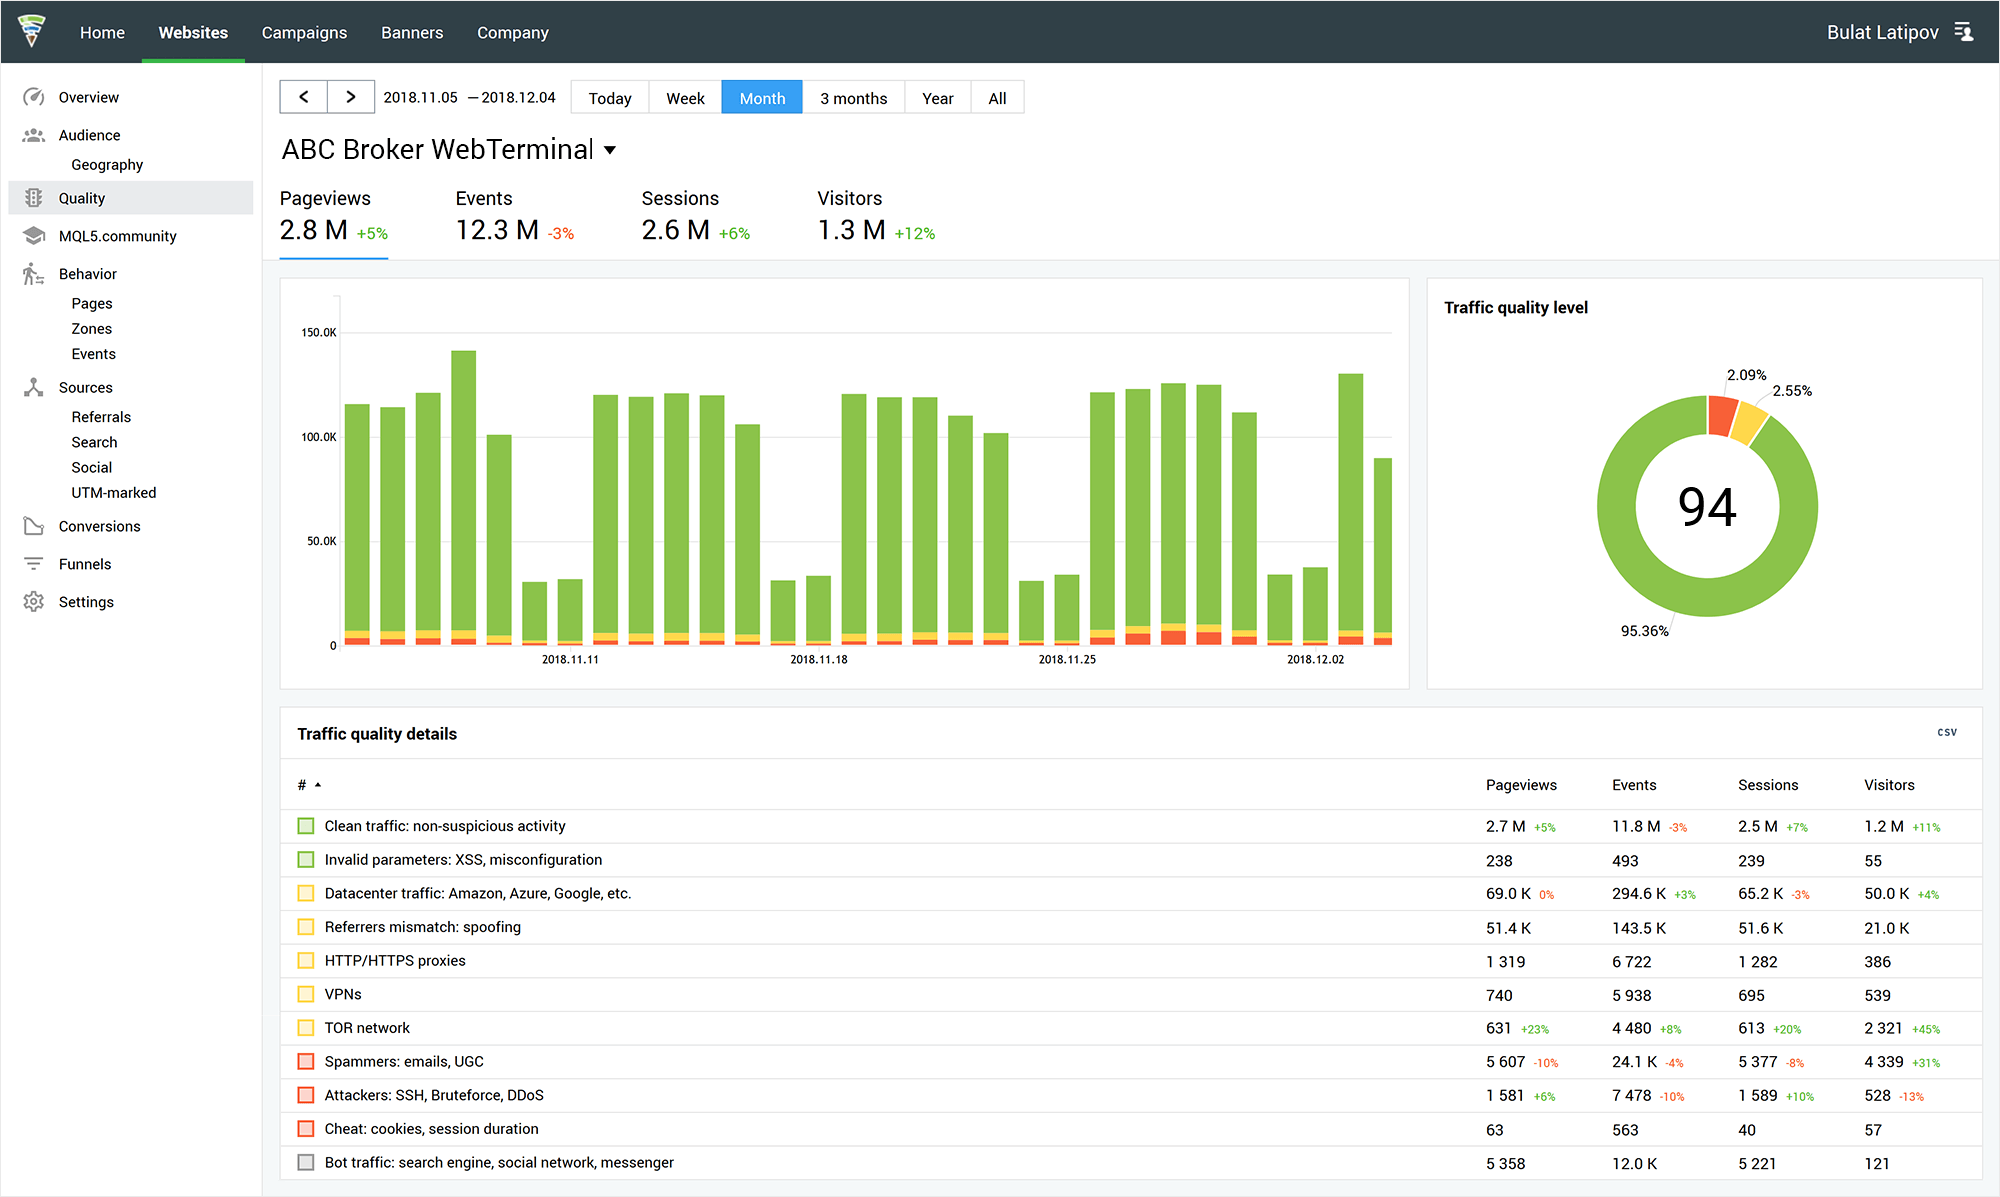
The advertising analytics service features a new section, which presents the incoming traffic type
The advertising analytics service features a new section, which presents the incoming traffic type. Information is grouped by colors for analysis efficiency:
- Green shows the pure traffic, which includes live users.
- Yellow reflects visits via proxy servers, VPN, Tor Browser, etc.
- Red features undesirable traffic, i.e. visits from spam IP addresses or hackers, as well as those trying to falsify request parameters and cookies.
- Gray color is used for service traffic generated by social networks, instant messengers and search engine bots.

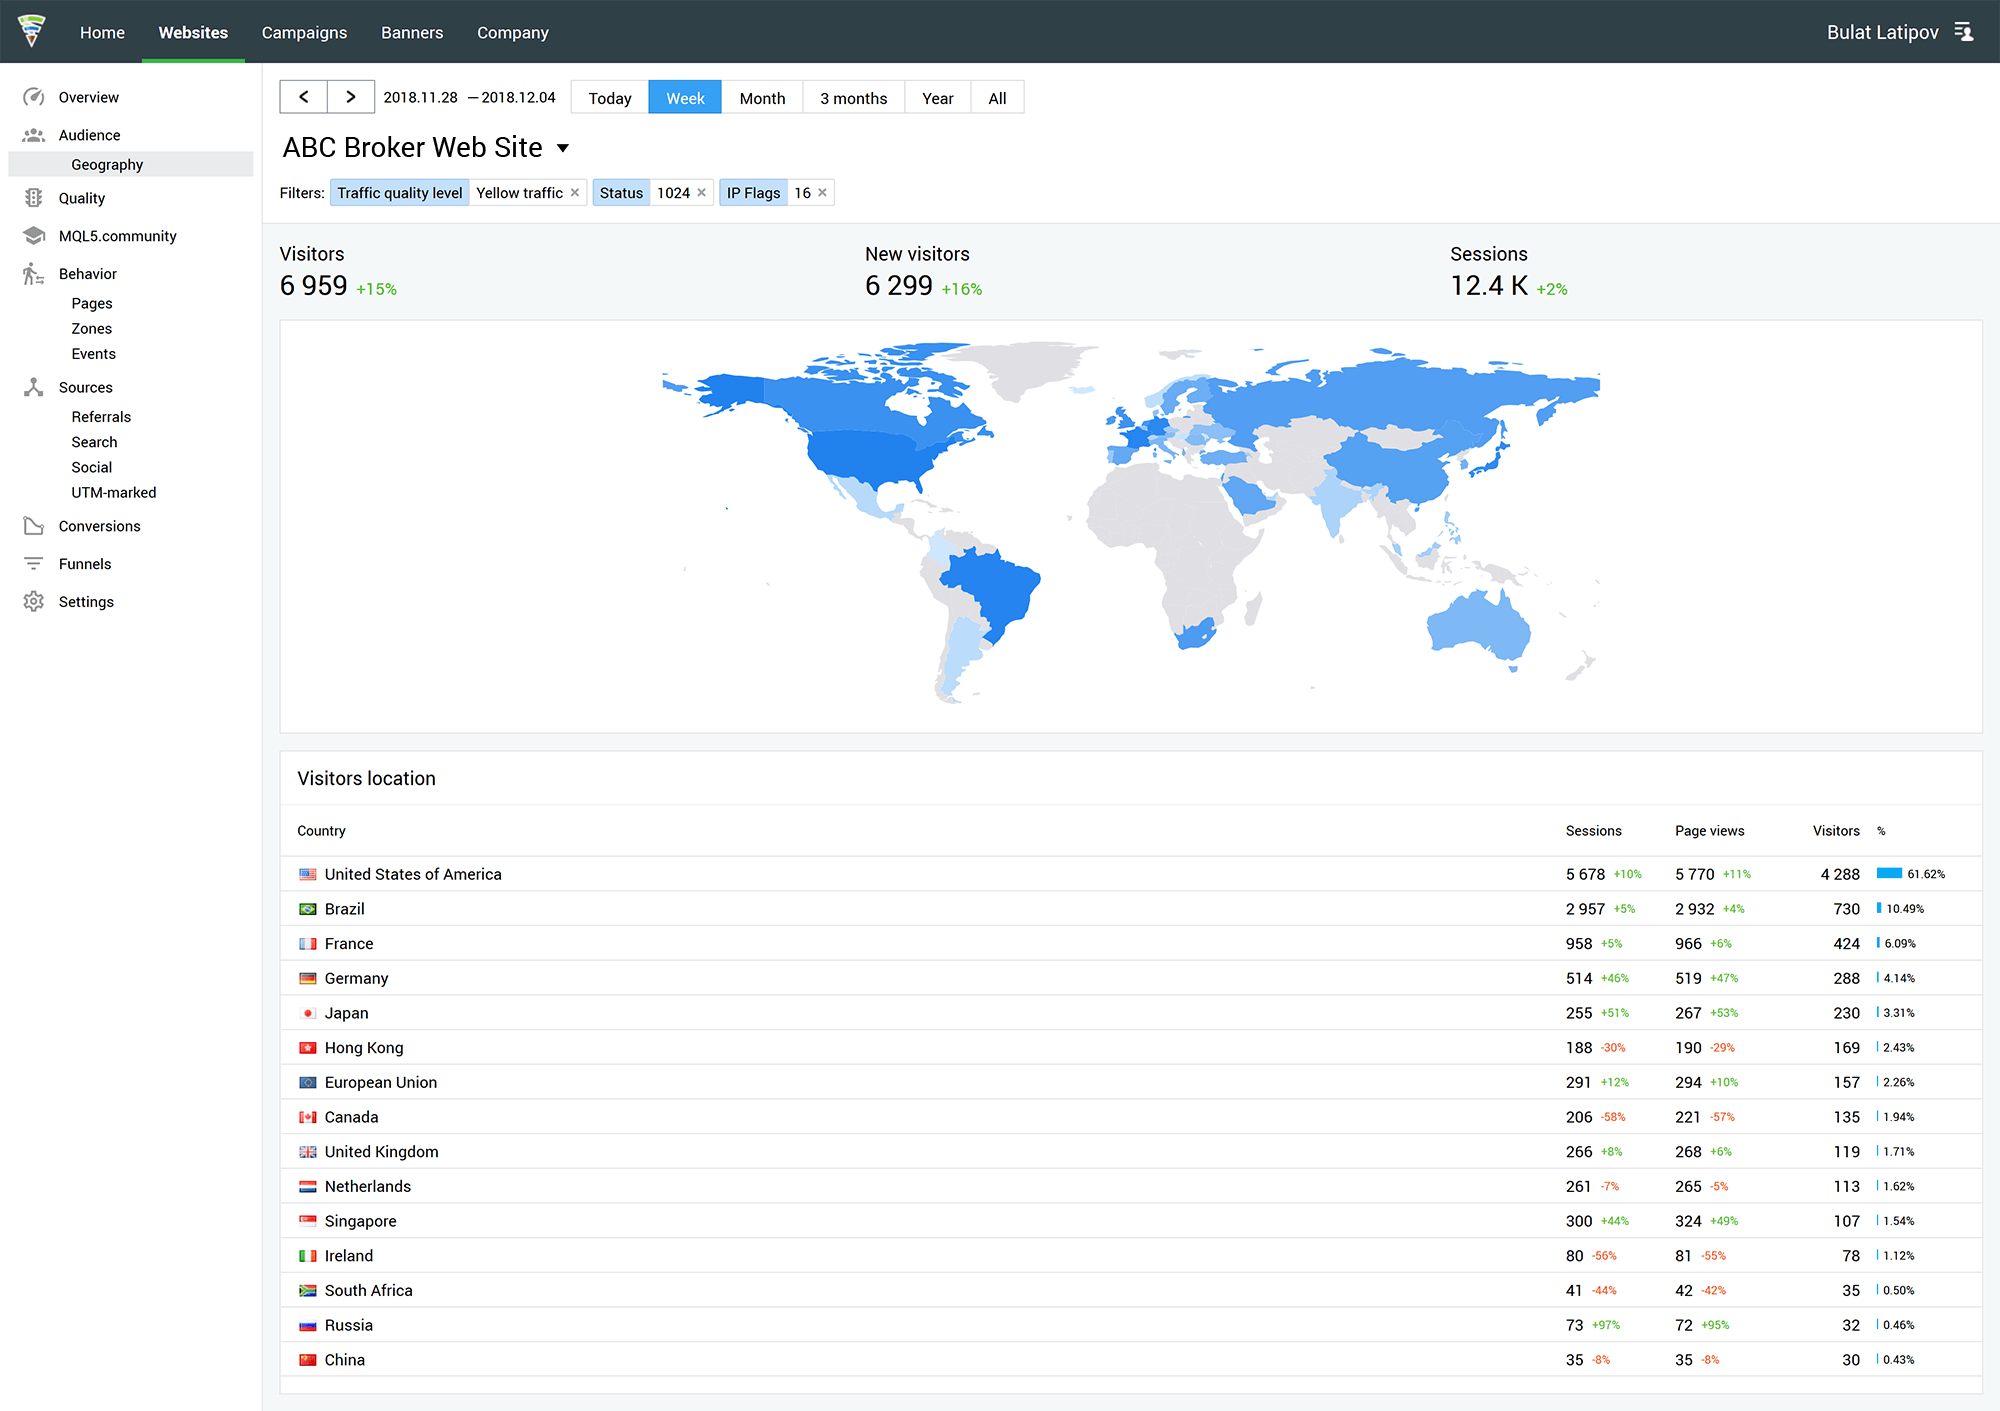
These reports can be used as a filter, similar to other data available in Finteza. Do you want to analyze visits from proxy servers? Click on the appropriate table rows and all other reports will also show data for the selected group of visits. Now this data can be compared with any other group. For example, you can analyze pages viewed by the selected groups, triggered events, related UTM tags and countries.

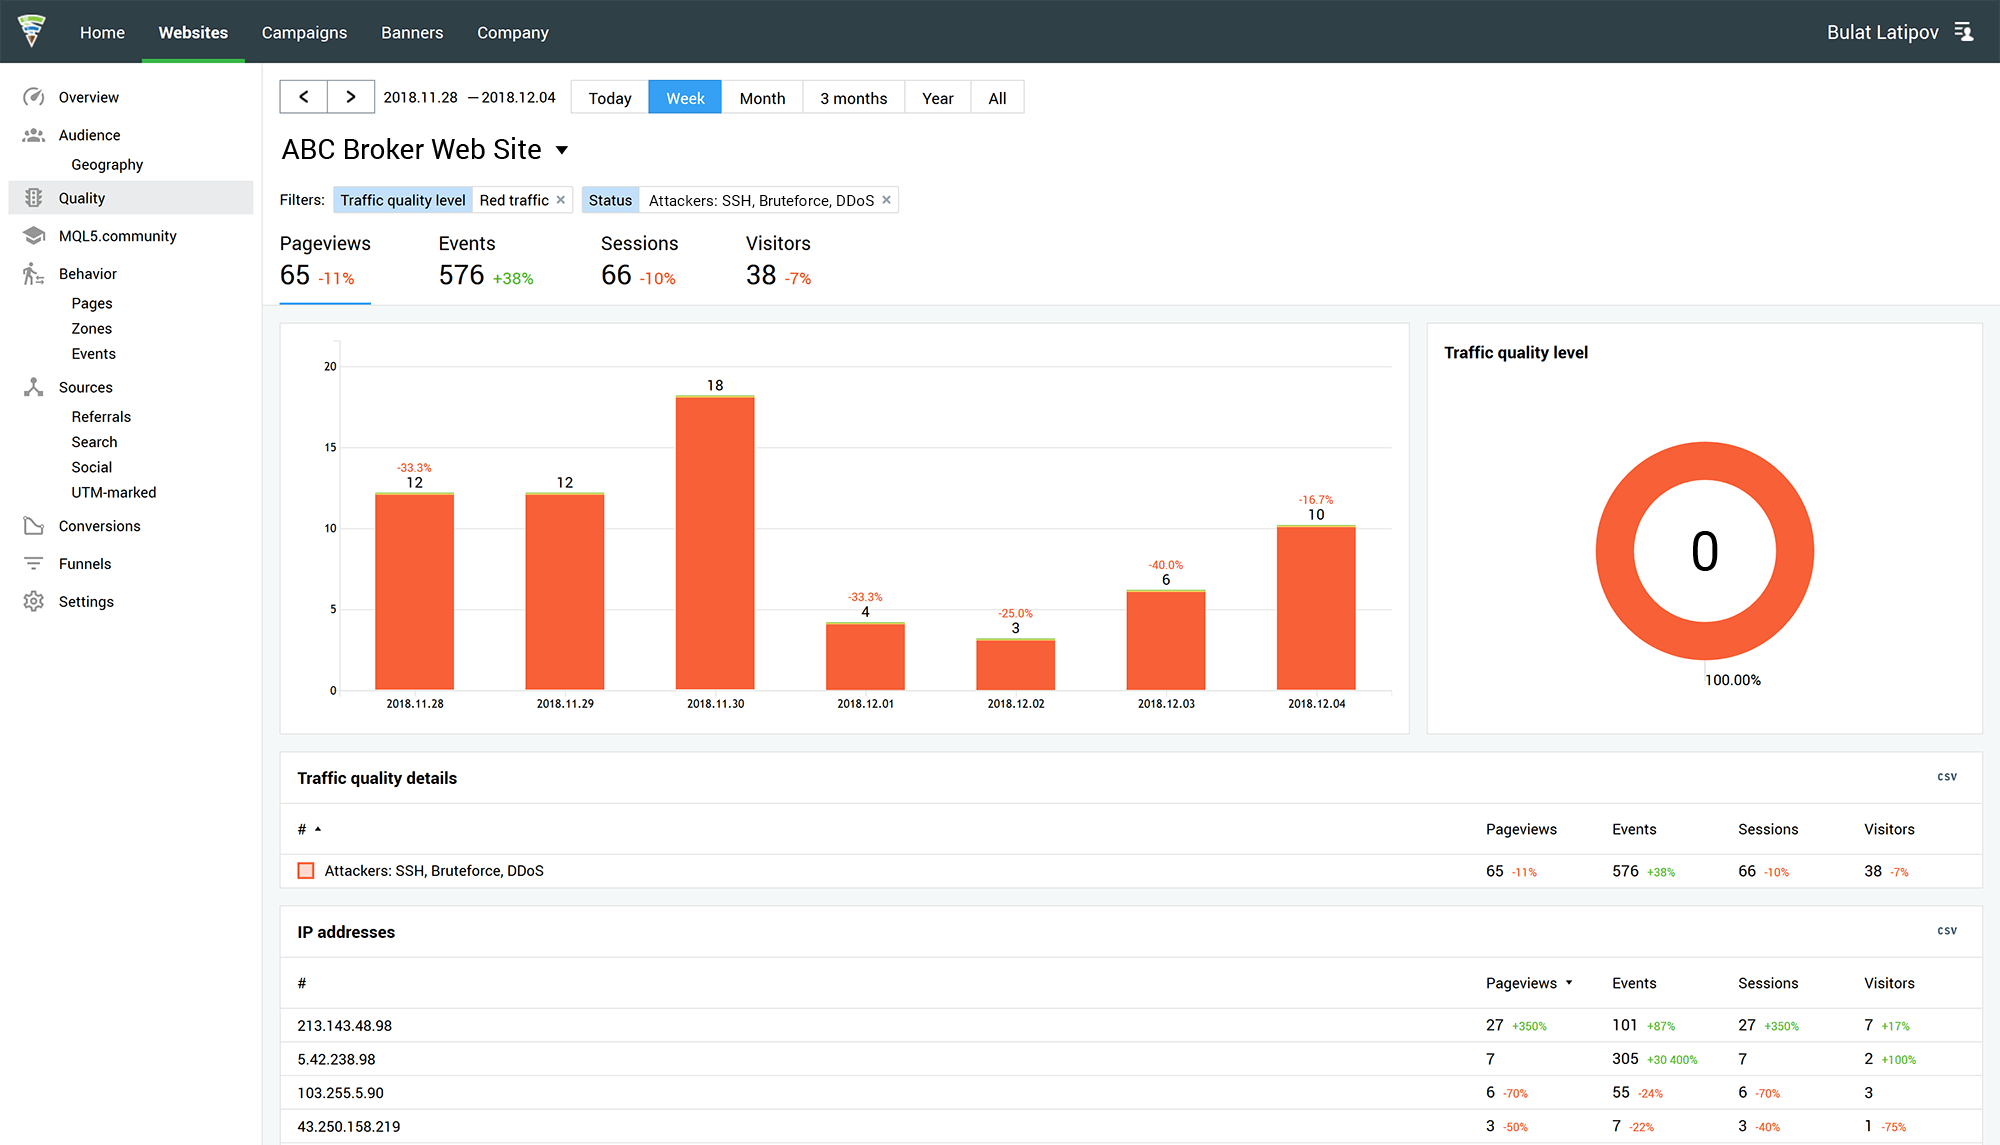
If an unexpected traffic increase is registered in a site, it is possible that there might be an external attack. The Quality Report will show a sharp increase in the “Attackers: SSH, Brute-force, DDoS” column, outlining the reason for such an increase.

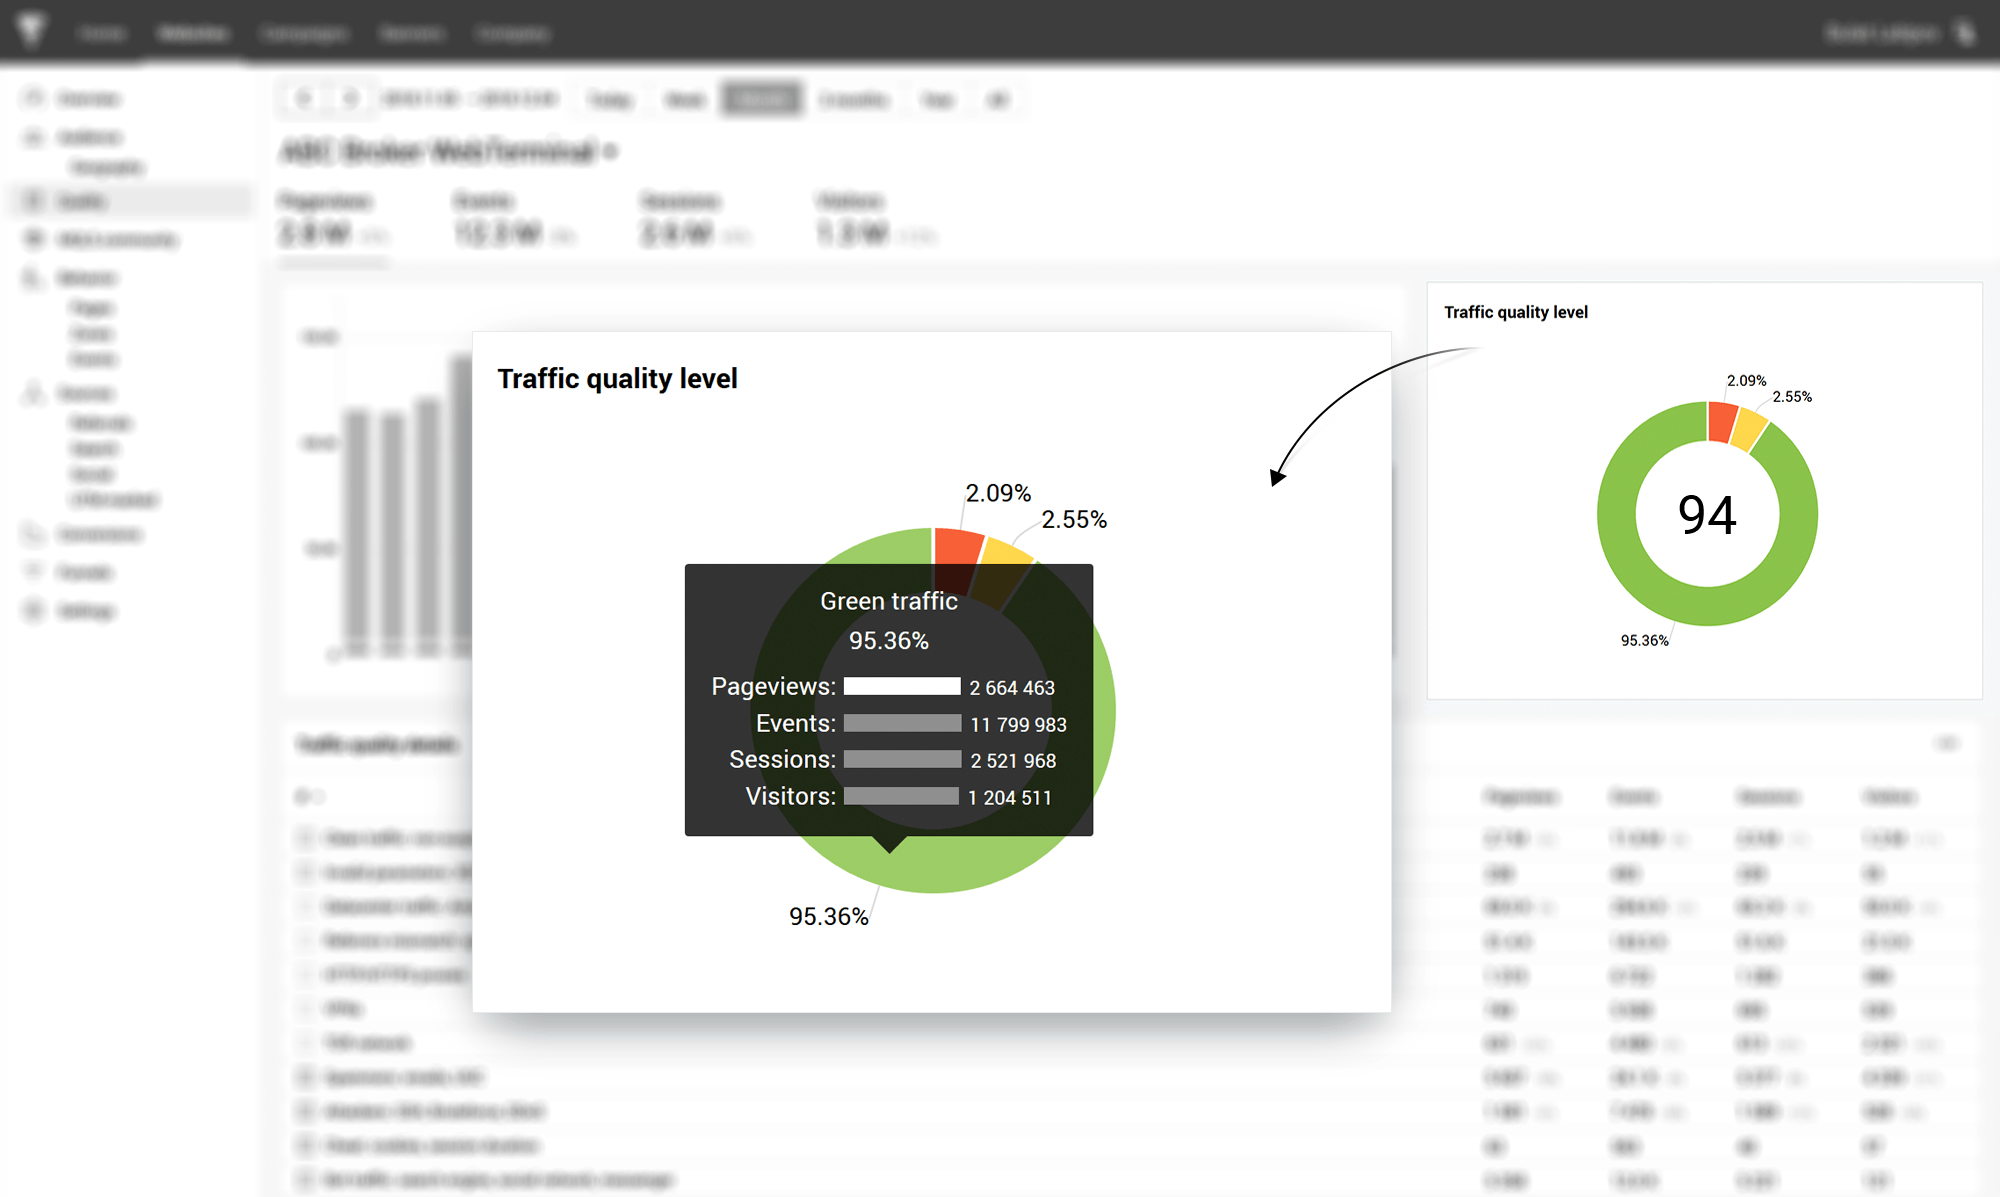
The donut chart shows generic traffic structure statistics over the selected period. The total rating is calculated as an integral variable, which assigns greater weight to green traffic, average weight to yellow traffic, and zero to red traffic. The higher the share of green traffic, the greater the rate.

The maximum value of 100 is hard to achieve, but it serves as an ultimate target. If the site rating falls below 80, its traffic structure and sources should be examined in more detail.
You can start using the new report right away. Add tracking code in your site to access automatically structured traffic statistics.
Create an account in Finteza and examine your website traffic!