24 April 2012
MetaTrader 5 Trading Terminal build 642
Added global search in the client terminal and at MQL5.com. The Search in the terminal allows you to quickly find information in all sections of the
Trading Terminal
Added global search in the client terminal and at MQL5.com.
The Search in the terminal allows you to quickly find information in all sections of the client terminal, Code Base and MQL5.com.
It is a case-insensitive search for a substring. The search is performed in the sections selected in the search parameters: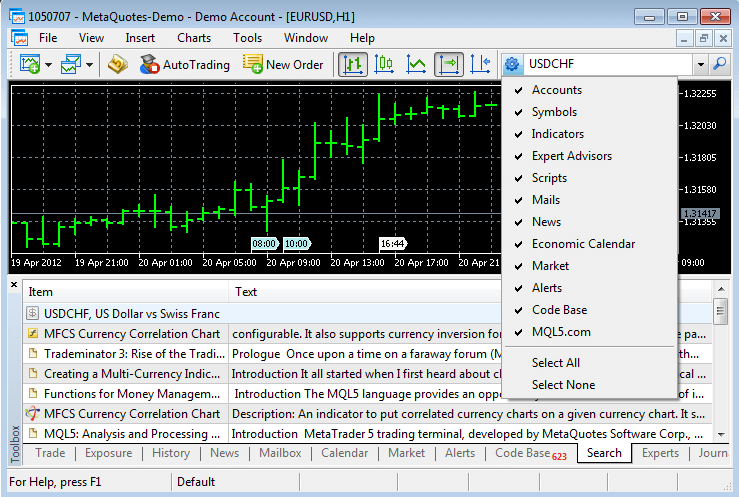
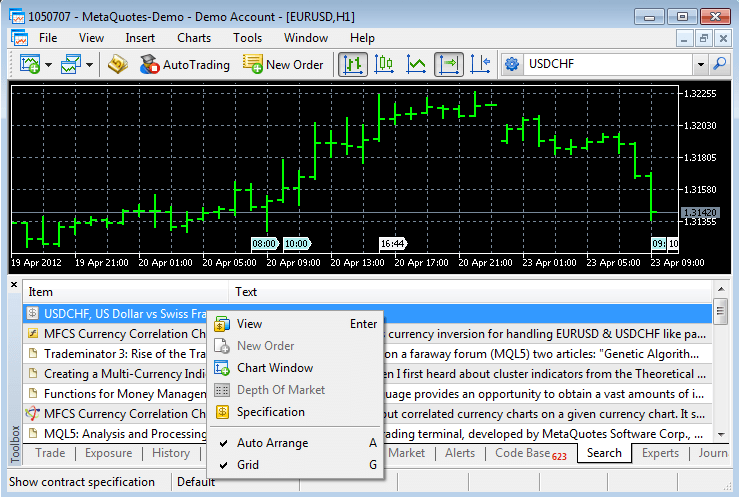
The context menu of the search results tab contains additional commands, which depend on the type of results:
- Fixed display of order volumes in the Market Depth for partially filled orders.
- Fixed checking of the expiry price of a pending order in the pending order placing dialog.
MQL5
Added asynchronous sending of trade requests OrderSendAsync.
Using this feature allows to speed up placing of trade requests, and especially when placing mass request, since in this case there is no need to wait for the results of the previous request when placing a new one. Because of its asynchronous nature, this function is not suitable for placing market orders for symbols with the Request execution mode.
The function performs the initial verification of a request on the side of the client terminal and enqueues it to send to the trade server without waiting for the results of sending and receiving of confirmation from the server.
If necessary, the operation of the function on the server is monitored by an Expert Advisor by handling the OnTrade event.
- Added a trading symbol property SYMBOL_ISIN (getting through the SymbolInfoString function) - the name of the trading symbol in the international system of securities identification numbers.
ISIN, International Securities Identification Number is a 12-digit alphanumeric code that uniquely identifies a security.
The availability of this symbol property is defined on the trade server side.
Strategy Tester
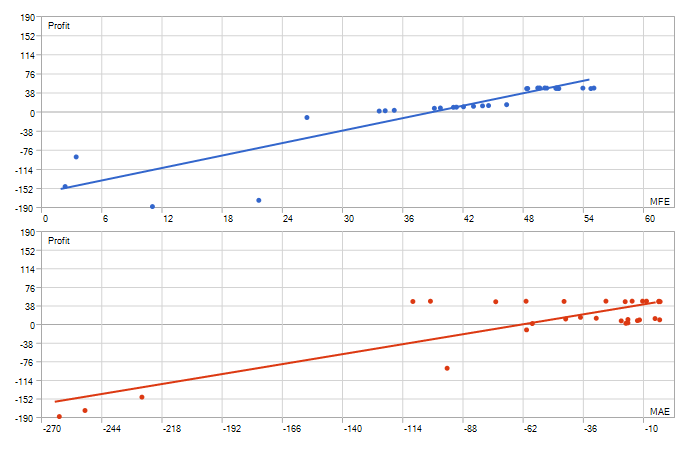
- Extended report of testing results - added MFE-Profit Correlation, MAE-Profit Correlation and MFE-Profits and MAE-Profits distribution graphs.
Maximum Favorable Excursion (MFE) - is the maximum potential profit reached while holding a position.
MFE-Profit Correlation - a correlation between the position returns and MFE. Each trade had its maximal profit and maximal loss between opening and closing. MFE shows profit in the favorable excursion of the price. Each trade is corresponded with its return and with two parameters - MFE and MAE. Thus, we can draw each trade on a plane where MFE is plotted along the Х-axis, the return is plotted along the Y-axis. The closer is the return to the MFE, the more complete was the favorable excursion of the price was used. The straight on the graph shows approximation by function Profit=A*MFE+B. The Correlation(Profits,MFE) allows to estimate relation between the profits/losses and the MFE. The closer to 1 is this value, the better will the trades fit into the approximation straight. The closer to zero it is, the less considerable is this relation. MFE characterizes the ability to realize potential profit.
Graph of MFE-Profits Distribution - points plotted on the graph MAE (X-axis) - Profits (Y-axis) indicate positions. Values of both axes are given in the deposit currency. Thus, for each transaction we see not only the acquired profit value including swaps along the Y-axis, but also maximally possible profit during the position lifetime. It allows us to estimate the quality of protection of the paper (unrealized) profit. Though the distribution of points along the chart gives a satisfactory view of the trade system, a linear regression, which is a least squares approximation, is given for an objective assessment. Ideally, the line should make with the X-axis an angle of 45 degree.
Maximum Adverse Excursion (MAE) is the maximum potential loss reached while holding a position.
MAE-Profit Correlation - a correlation between the position results and MAE. MAE - Maximum Adverse Excursion. Each trade reached its maximal profit and maximal loss between opening and closing. MAE shows the loss during the adverse excursion of the price. Each trade is corresponded with its return and with two parameters - MFE and MAE. Thus, we can plot each trade on a plane where MAE is plotted along the Х-axis, the return is plotted along the Y-axis. The closer is the return to the MAE, the more complete was the protection against the adverse excursion of the price. The straight on the graph shows approximation by function Profit=A*MAE+B. The Correlation(Profits,MAE) allows to estimate relation between the profits/losses and the MAE. The closer to 1 is this value, the better will the trades fit into the approximation straight. The closer to zero it is, the less considerable is this relation. MAE characterizes the drawdown obtained within the position lifetime and characterizes the use of protective Stop Loss best of all.
Graph of MAE-Profits Distribution - Points plotted on the graph MAE (X-axis) - Profits (Y-axis) indicate positions. Values of both axes are given in the deposit currency. Thus, for each transaction we see not only the acquired profit value including swaps along the Y-axis, but also the maximal drawdown within the position lifetime. It allows us to estimate the transaction according to drawdown waiting out. Though the distribution of points along the chart gives a satisfactory view of the trade system, a linear regression, which is a least squares approximation, is given for an objective assessment. The less trades have negative values X (MAE), the better. It also allows making a decision based on the graphical analysis about maximally accepted losses, after which the possibility of taking profit is very small (if the analysis is carried out on the same currency pair and in points).
- In the visual tester implemented automatic addition of the used indicators to the charts of other symbol-periods.
- Fixed a bug when stopping visual testing of multicurrency Expert Advisors, which led to numerous messages "stopped by user" in the tester Journal.
- Fixed optimization crash when adding a new testing agent during optimization.
MetaEditor
- Enhanced MQL5 Storage control functions.
Added new commands for managing the storage of source files that make the use of the MQL5 Storage even more convenient:
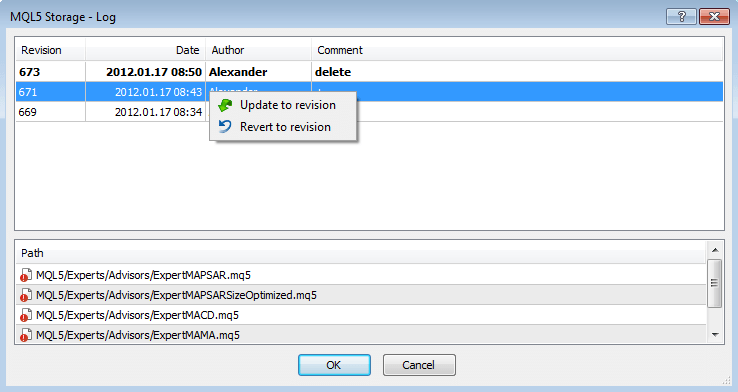
- Update to revision - selected files are supplemented with information from the files in the specified revision. In files with identical names data are merged. If files have been added to a revision, they will be added to the local copy. If files have been deleted from a revision, they will be deleted from the local copy.
Revert to revision - selected files are replaced by the files from the specified revision. All changes made to the selected files disappear.
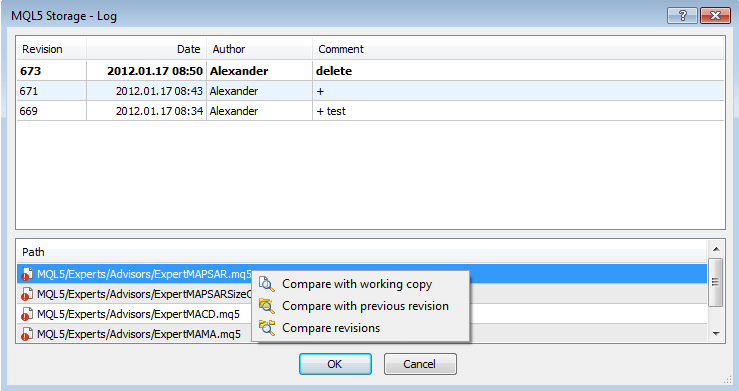
- Compare with the working copy - files of a selected revision are compared with their current state on the local computer.
- Compare with previous revision - compare the current and the previous revision of the files.
- Compare two revisions - compare file changes in two specified revisions.
Fixed errors reported in crash logs.
Updated documentation.
The live update is available through the LiveUpdate system.
The MetaTrader 5 Trading Terminal can be downloaded at https://download.mql5.com/cdn/web/metaquotes.ltd/mt5/mt5setup.exe?utm_source=www.metatrader5.com