MetaTrader 5 iPhone/iPad HelpChartObjects

Objects

Objects in the platform mean objects that are added manually to a chart. These objects are used for analytical purposes. This group of functions includes:

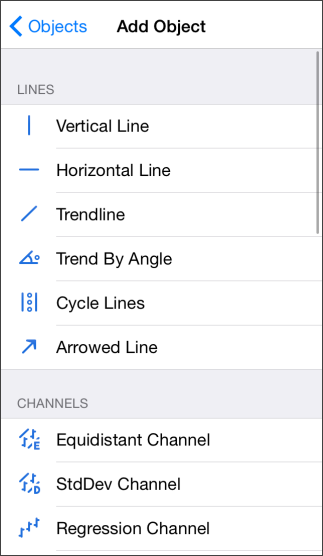
  • Lines – various lines (trend lines, horizontal, cyclic lines, etc.) added to price charts and indicators.
  • Channels – various channels (equidistant, regression channel, etc.) added to price charts and indicators.
  • Gann Tools – a set of technical analysis tools developed by W. D. Gann.
  • Fibonacci Tools – a set of technical analysis tools created on the bases of the numerical sequence by L. Fibonacci.
  • Elliott Tools – a set of tools technical analysis based on the wave theory of R. N. Elliott.
  • Shapes – geometric shapes (square, triangle, and ellipse) that allow to mark various areas in the price chart.

How to Add an Object

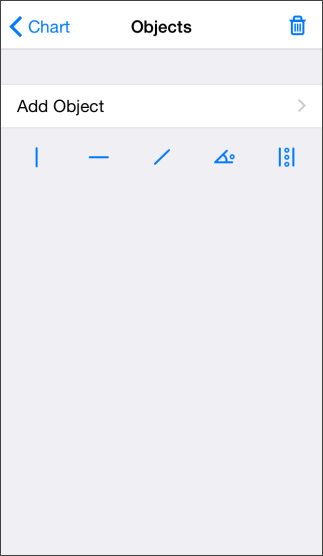
To add an object, tap Objects at the top of the chart. Then tap "Add object" or select one of the recently used objects below.

Adding an object Selecting an object

Upon object selection, a chart will open with an icon of the selected object.

The total number of objects on all charts cannot exceed 128. If you try to add more objects, the oldest objects will be automatically deleted.

How to Drawing an Object

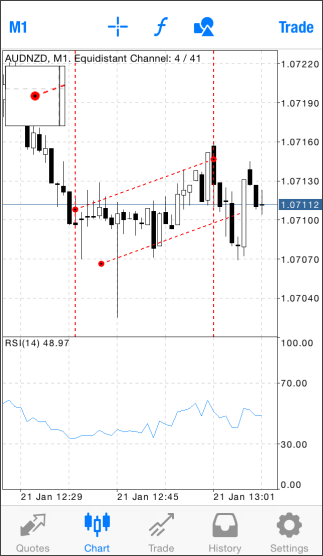
Objects may have different numbers of changing and moving points depending on their type. As a rule an object can be moved using its central point. To create most objects, you need to specify one or more initial points and then, holding your finger down, set the direction and size.

When you move the object point, a special subwindow with the zoomed chart will appear in the upper left corner of the chart to allow you to accurately position the object. For more information on object drawing and modifying using points, please read descriptions of objects.

When you move the point close to one of the bar prices (Open, High, Low or Close), the object point will be automatically snapped to this price level. This option is included for the convenient positioning of objects on a chart.

Created objects can be copied. This enables faster chart markup. Open the object menu with a long press and select "Copy".

When dragging an object using its moving point (central point) snapping does not work.

Drawing an object

Object Properties

How to Modify an Object

After the object has been created, it can be moved or modified. To do so, select the object first by tapping on it. The object can be considered as selected if markers (object points) appear. The markers are used for moving objects and changing their drawing parameters.

Thus, for example, to change the Fibonacci Fan location, hold its central marker and move it to the desired position. Moving of any of its extreme markers changes the object drawing parameters.

To delete an object or call its properties long-tap (about 1 sec) on it on the chart.

Object Properties #

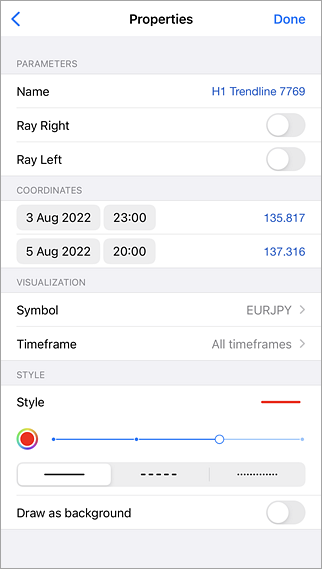
Every object has its specific properties. Properties can differ depending on the object. To manage the properties of an object, long-tap on it on the chart and then select "Properties" from the context menu. You can also tap on Objects at the top of the chart and select one of the added objects.

The following is available here:

  • Name – the unique name of an object within one chart, it is set automatically. It can be changed if another name is entered in this field. Such names make it easy to find an object among many other objects of the same type.
  • Ray right/left – displaying trend lines as rays in the specified directions.
  • Coordinates – one or several snap points along the time and price axes.
  • Visualization – instruments and timeframes, in which the object will be displayed. If the object should have different settings depending on the chart period, create several copies of the object and enable the display for each of them in the required timeframe.
  • Style – object lines style. Color, style and width of lines can be set here.
  • Draw as background – draw the object in the background layer, behind the chart. For shapes and channels (except for the Fibonacci channel), enabling this option sets color filling for the object.
  • Levels specific display settings for the levels of Fibonacci tools and Andrews' Pitchfork.

Some object have specific properties like "Gann Angle", "Pips per bar". etc. Description of these properties in available in corresponding object sections.

How to Delete an Object

All objects applied to a chart become unnecessary sooner or later, and they can be removed using the object managing menu. Tap Objects at the top of the chart.

Objects can be deleted as follows:

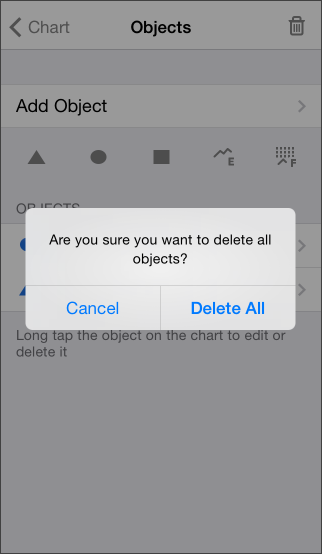
  • Tap Delete in the upper right corner of the screen. Here you can delete all objects from the chart.
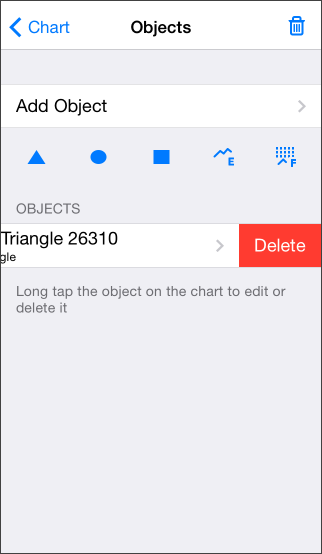
  • Swipe from right to left on the object line. To remove an object, use the "Delete" button that appears.

Deleting all objects Deleting a single object