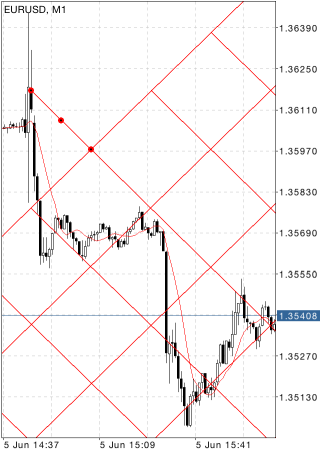
Gann GridGann Grid represents trends built at the angle of 45 degrees (Gann Lines). According to Ganns concepts, a line having a slope of forty-five degrees represents a long-term trendline (ascending or descending). While prices are above the ascending line, the market holds bull directions. If prices hold below the descending line, the market is characterized as a bear one. Intersection of the Gann Line usually signals of breaking the basic trend. When prices go down to this line during an ascending trend, time and price become fully balanced. The further intersection of Gann Lines is an evidence of breaking of this balance and possible change of the trend. |
|
DrawingTo draw Gann Grid, one select this object and indicate an initial point in the chart. After that holding the finger drag it to the second point setting thus the size of cells. An additional parameter will be shown near this point – distance along the time axis from the initial point. ManagementOn the main line of Gann Grid there are three points that can be dragged. The first and last points are used for setting the grid cell size. The central point (moving point) is used for moving Gann Grid in the chart without changing its dimensions. The slope of lines is defined by the "Pips Per Bar" parameter described below. |
|
|
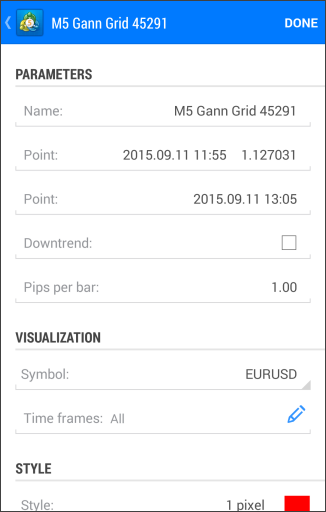
ParametersThere are the following parameters of Gann Grid:
Common parameters of object are described in a separate section. |

