Code profiling
Profiling means collecting program parameters during its execution. During a profiling, the execution time and the number of calls of individual functions and program code lines are measured. With this tool, the programmer is able to find and optimize the slowest code sections.
Profiling can be performed on the normal chart of the trading platform, as well as using history data in the Strategy Tester. In the first case, a program is launched on a chart that is updated in real time. You can check the program behavior in real conditions. In the second case, the program is launched in the Strategy Tester in the visual mode. The advantage of this method is that you do not need to wait for real data from a trade server or occurrence of certain trading conditions.
Many programs, especially indicators, only perform calculations at the arrival of a new tick (OnTick, OnCalculate). Thus, in order to evaluate performance, you have to wait for new ticks in real time. When profiling using history data, you can immediately provide the required load and test the program performance even on weekends when markets are closed.
How profiling works
The "Sampling" method is used for profiling. The profiler pauses the operation of an MQL program (~10 000 times per second) and collects statistics on how many times a pause occurred in a particular code part. This includes analyzing call stacks to determine the "contribution" of each function to the total code execution time. At the end of profiling, you receive information about how many times execution was paused and how many times each of the functions appeared on the call stack:
- Total CPU [unit,%] – how many times the function appeared in the call stack.
- Self CPU [unit of measurement,%] – the number of "pauses" which occurred directly within the specified function. This variable is crucial in identifying bottlenecks: according to statistics, pauses occur more often where more processor time is required.
Sampling is a lightweight and accurate method. Unlike other methods, sampling does not make any changes to the analyzed code, which could affect its running speed.
Profiling settings
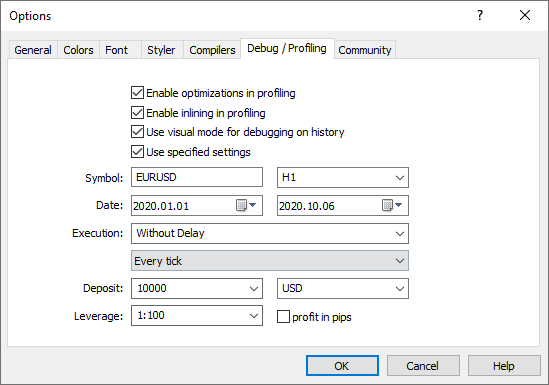
By default a program is run on the current open chart for profiling. If profiling is performed on historical data, the current settings of the strategy tester are used. You can use MetaEditor Options to set specify any other chart or to redefine some of the tester settings.

The same setting section allows enabling or disabling function inlining during compilation. During inlining, the function code is added directly to call its call site, which enables significant program acceleration in come cases. However, this procedure makes the profiling of functions difficult. In order to obtain a report on "pure" functions, you can disable inlining.
This option only disables explicit inlining. The functions which are implicitly generated by the compiler may still be used. Such functions are displayed with the [inlined] prefix.
Code optimization mode can be disabled in order to include more details in the profiling report. Code speed without optimization can be several times slower, but this mode provides a wider code coverage. Please note that code bottlenecks can be imprecise without optimization.
The optimization management option is also available under project settings.
- If optimization is disabled in the project, then the new option is ignored and optimization will always be disabled for profiling (including inlining operations).
- If optimization is enabled in the project, then the new option will be taken into account during profiling compilation.
Launching profiling #
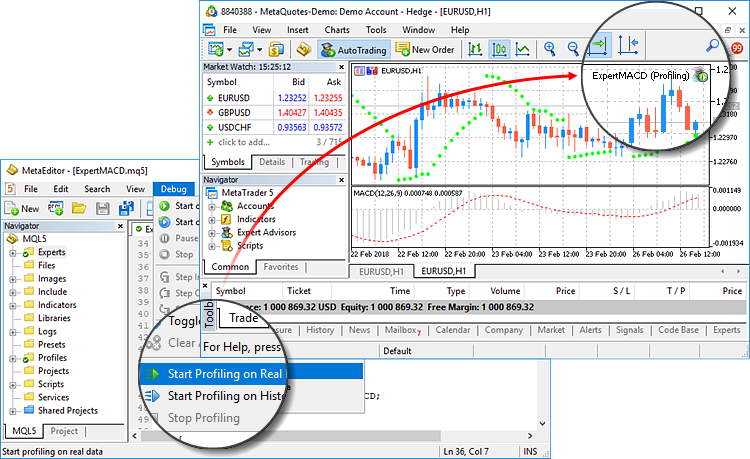
Open a program's source code (MQ4 or MQ5). In the Debug menu or Standard toolbar, press "![]() Start profiling on real data" or "
Start profiling on real data" or "![]() Start profiling on history data".
Start profiling on history data".
After that, a special program version for profiling will be compiled automatically. Depending on the selected profiling type, the program will be launched on a normal chart in the trading platform or in the Strategy Tester.

|
After the launch, work with the application for some time to try all its features to the maximum. This is necessary in order for the profiler to measure the execution time of all program's functions and lines.
Then stop profiling: delete program from the chart or click ![]() Stop Profiling of the Debug menu or in the Standard toolbar.
Stop Profiling of the Debug menu or in the Standard toolbar.
For more accurate profiling results, it is recommended to manually remove the program from the chart instead of using the |
Viewing the profiling results
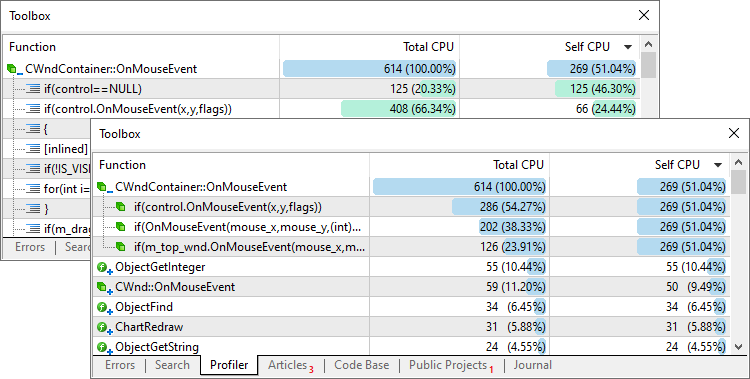
After profiling is finished, the results are displayed in the Profiler tab of the Toolbox window. The results are additionally displayed directly in the code: lines with the appropriate functions are highlighted. The brighter the highlighting, the longer it took to complete the function. This features enables a quick and visual spotting of program bottlenecks.
The profiling report is presented as functions or program lines, for each of which there are two indicators available:
- Total CPU [unit,%] – how many times the function appeared in the call stack.
- Self CPU [unit of measurement,%] – the number of "pauses" which occurred directly within the specified function. This variable is crucial in identifying bottlenecks: according to statistics, pauses occur more often where more processor time is required.
The value is displayed as an absolute quantity and as a percentage of the total quantity.
By default, the list shows large functions located at the top levels. Double-click on the line to switch to smaller functions.

The profiling report can be viewed in two modes: by calls and by lines. The second method allows exploring code with maximum detail and to identify not only the slowest functions, but also the slowest parts of such functions. Use the context menu to switch between modes.
For convenience, various elements of the MQL language are displayed as icons in the report:
 – a custom function.
 – a system function.
 – an event handling function (On*).
 – a class method.
 – a protected class method.
In addition to these types of functions, the profiler displays:
 @global_initializations – data on the initialization of all global variables.
 @global_deinitializations – data on the deinitialization of all global variables.
To view the line number and path to the file where the function is located, hover the mouse cursor over the appropriate line in the report. To view a function in a file, double-click on it.
The profiler displays not all functions but only the ones called during the program operation. |
Context menu #
The following commands are available in the context menu:
- Open – go to a line or a function in a source code file. The same can be done by double-clicking or pressing Enter.
- Expand All – expand all collapsed functions.
- Collapse All – collapse all expanded functions.
- Functions by Lines – view the profiling results by lines.
- Functions by Calls – view the profiling results by calls.
- Export – export profiling results in Open XML (MS Office Excel), HTML (Internet Explorer) or CSV (Text file).
- Auto Arrange – enable/disable automatic sizing of fields. The same action is performed by pressing A.
- Grid – show/hide grid to separate fields. The same action is performed by pressing G.